


The Nasdaq 100 continues to sit on its highs along with the other US indices, and this quite frankly makes trading difficult. With where the market currently sits and without volatility, the market appears to be too high to buy, too strong to short. It makes establishing fresh positions in either direction particularly tricky.
The thinking is that we will soon see a bit of a reversal in fortunes, but until sellers show up trying to find a top is typically a tough business. One chart we looked at today was the weekly Nasdaq 100 (log scale), where a clear bull market channel is apparent. The NDX is approaching the upper crust of the channel, and should it do so soon it might mark the top of the current rally.

Nasdaq 100 Weekly Chart (watch upper parallel)
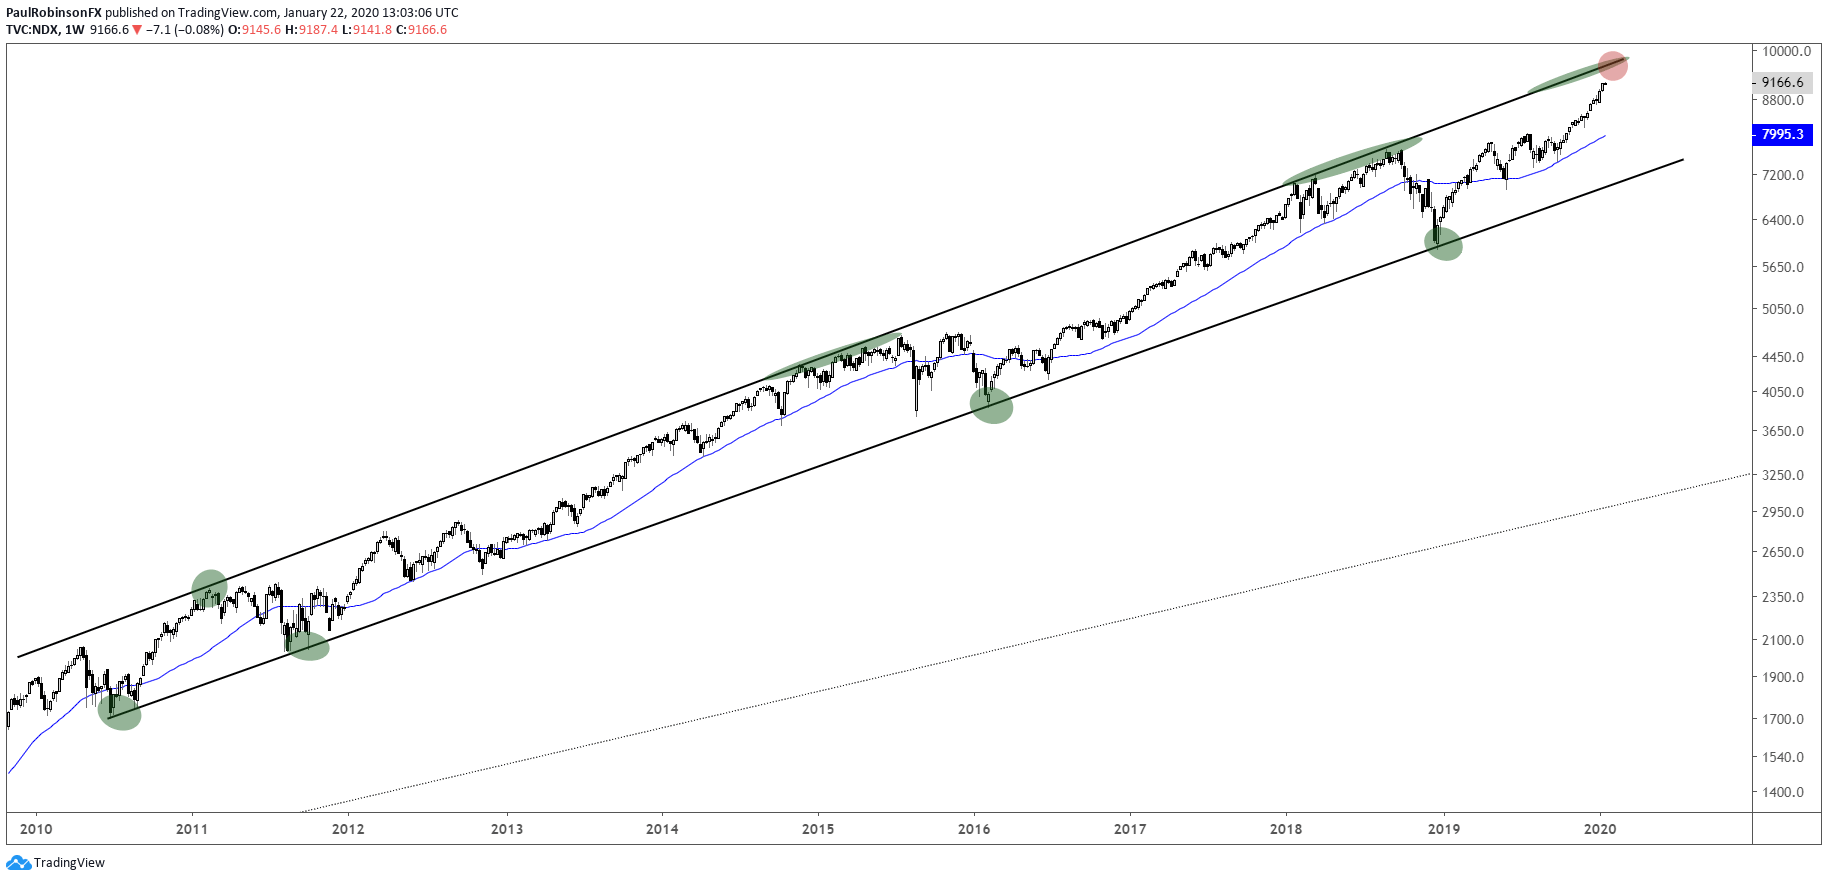
Nasdaq 100 Chart by TradingView
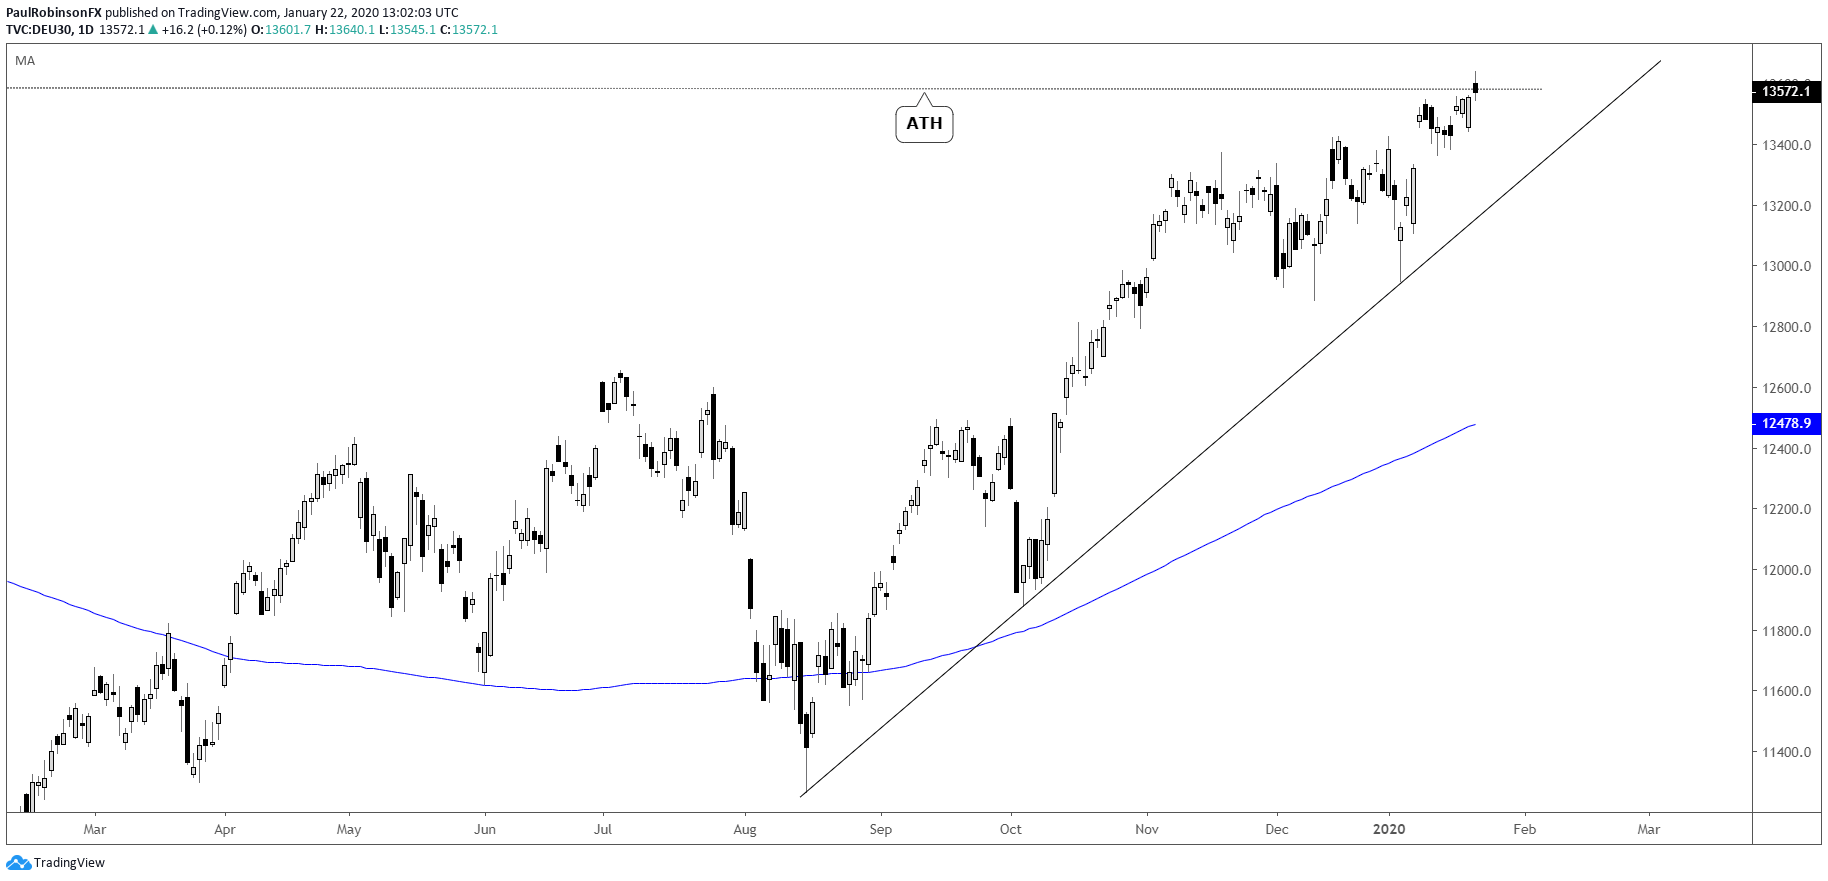
The DAX is traversing around the record high, with it having notched a new record intra-day today. The grind higher to a new ATH is worth watching as the US markets continue into extended territory. The lagging nature of the DAX (&CAC) could mean if the leading US indices turn down these will be quick to take a hit. The trend-line off the August low, as long as it is held, is seen as keeping the downside in check.
DAX Daily Chart (working on new highs)
Crude oil is teetering on support, support that could break any time now. There is confluence between the trend-line from October and the 200-day MA. A close below 57.40 is seen as having oil rolling further downhill since its earlier-month peak. Watch the 55.40/54.77-area as next up for support should we soon see a confirmed break.

Crude Oil Daily Chart (sitting on confluent support)
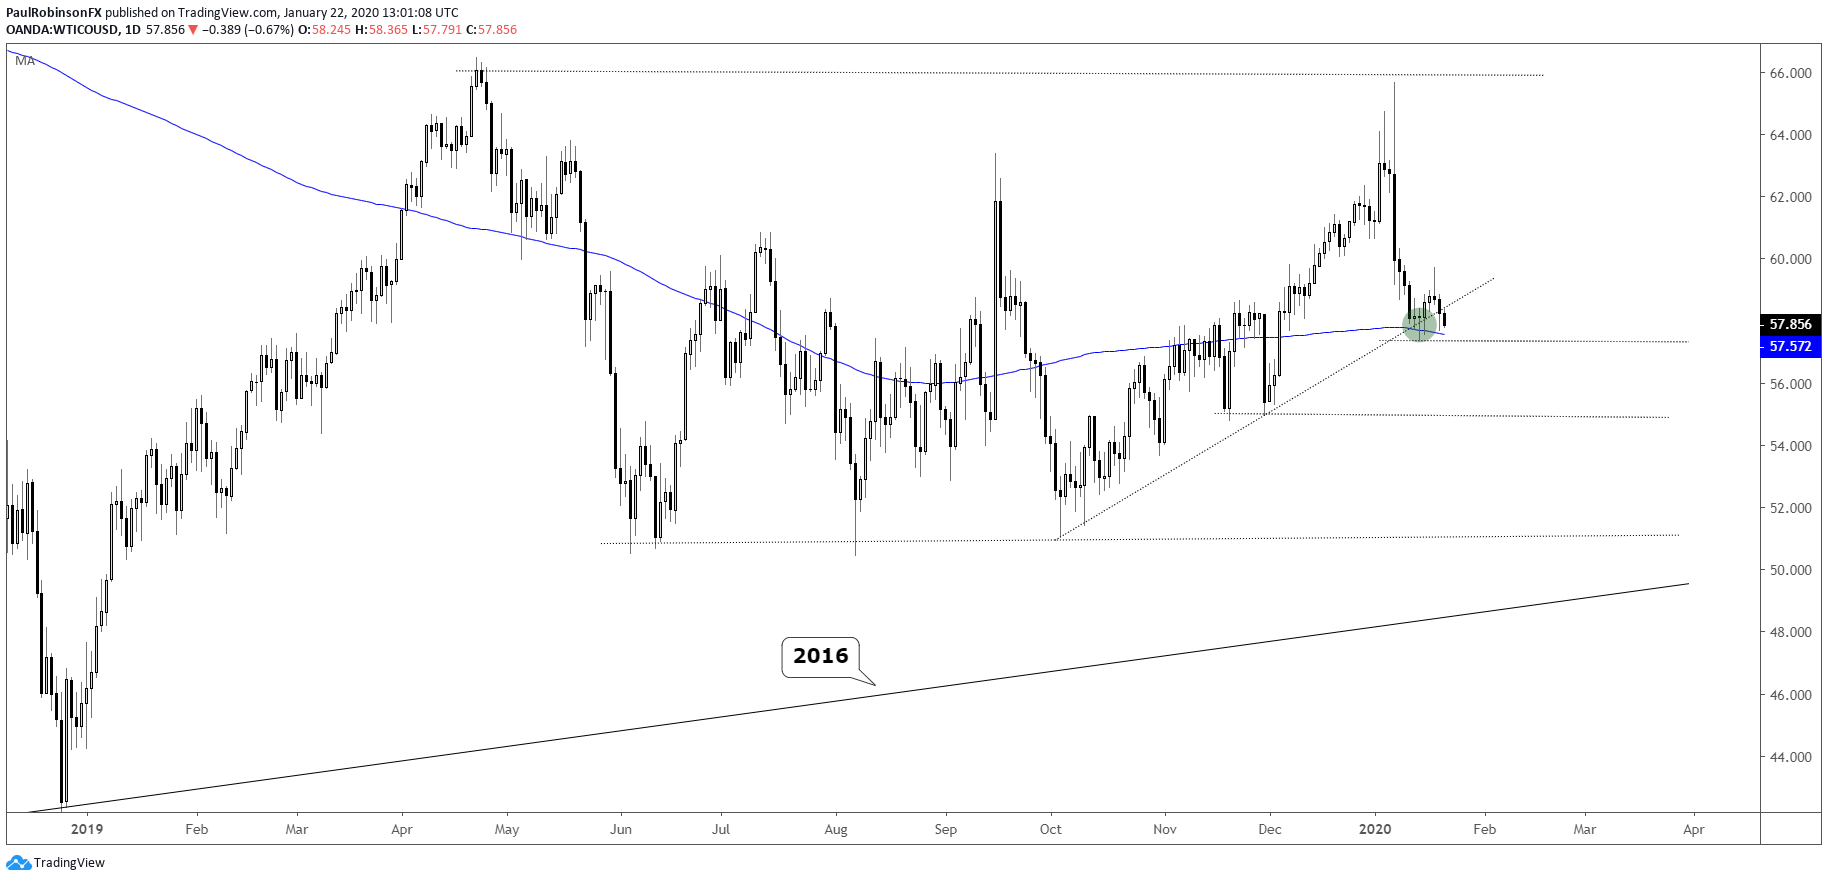
Crude Oil Chart by TradingView
To see all the charts we looked at, check out the video above…
Resources for Index & Commodity Traders
Whether you are a new or an experienced trader, DailyFX has several resources available to help you; indicator for tracking trader sentiment, quarterly trading forecasts, analytical and educational webinars held daily, and trading guides to help you improve trading performance.
We also have a series of guides for those looking to trade specific markets, such as the S&P 500, Dow, DAX, gold, silver, crude oil, and copper.
---Written by Paul Robinson, Market Analyst
You can follow Paul on Twitter at @PaulRobinsonFX


