


Crude Oil Price Forecast:
- Crude oil has slipped nearly $10 since its recent high on January 8
- With easing tensions in the Middle East, crude has lost the x-factor that sparked a brief rally above resistance
- Technical support has helped save price for now, but it may only delay the inevitable break lower
Crude Oil Price Outlook: WTI Falters, Can Support Rescue Price?
Crude oil suffered a notable decline on Wednesday, falling more than 1.5% to pressure support around the $56.80 level. After surging on the back of tensions in the Middle East earlier this month, a cooldown in conflict has left the commodity without a key catalyst and left crude oil grasping for support. But can the series of technical levels keep crude oil afloat or will they just delay the inevitable?
Crude Oil Price Chart: Daily Time Frame (October 2018 – January 2020)
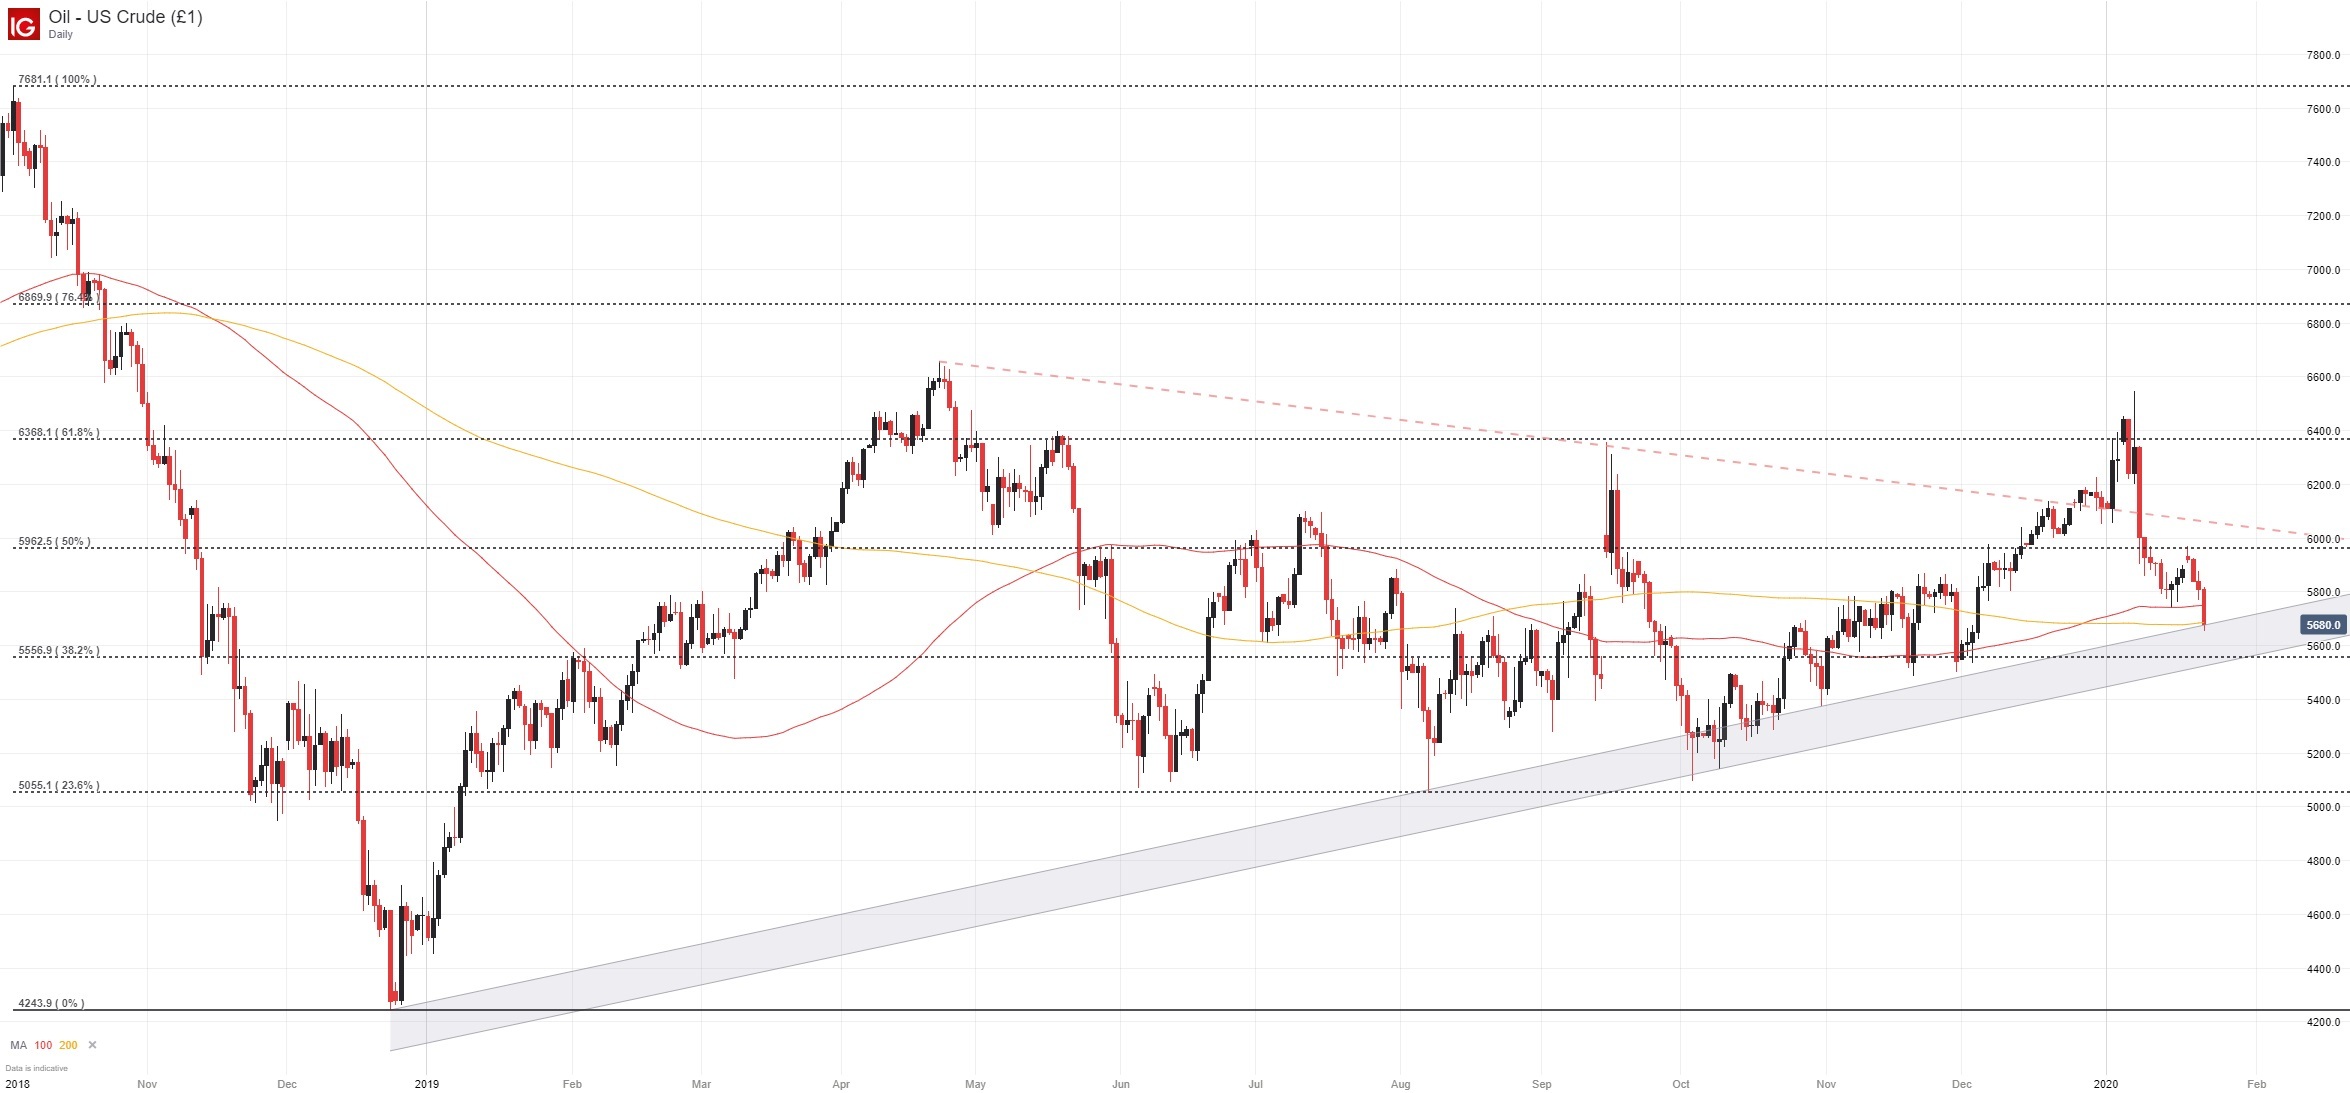
To be sure, crude oil finds itself in a vulnerable position. Trading narrowly above the ascending trendline from late 2018 and the 200-day simple moving average, a daily close beneath $56.80 would see crude break into the channel and threaten further losses. That being said, selling could gain pace if crude pierces the bottom of the channel, around $55.60. The area also coincides with a Fibonacci level that has proved influential in the past.
| Change in | Longs | Shorts | OI |
| Daily | 0% | -7% | -2% |
| Weekly | -7% | 1% | -5% |
Evidently, crude oil possesses significant technical support at the current price – but lacks a clear fundamental tailwind that could also work to buoy price. Furthermore, IG Client Sentiment Data reveals a recent shift in positioning amongst retail traders. Transitioning from net-short to net-long, the data suggests crude may continue to trade lower. In the meantime, follow @PeterHanksFX on Twitter for updates and analysis.
Should crude oil indeed break lower, $53.70 may provide initial support before the Fibonacci level around $50.54 would be required. Still, a move of this magnitude might require multiple days or weeks to fully unfold and would likely coincide with a broader pullback in risk assets like the Australian Dollar and S&P 500.
--Written by Peter Hanks, Junior Analyst for DailyFX.com
Contact and follow Peter on Twitter @PeterHanksFX
Read more: Dow Jones, Nasdaq 100, S&P 500 Outlook: Boeing, Netflix Drag on Stocks


