


Bitcoin (BTC) Price Forecast, Analysis and Chart:
- Bitcoin (BTC) trades in a $700 range over the weekend.
- BTC needs to consolidate if it is to push higher.
If you are interested in trading the cryptocurrency market, we have produced a Day Trading Guide to Bitcoin and Other Cryptocurrencies to help you better understand this highly volatile asset class.
Cryptocurrency Rally Hits Reverse Gear
Bitcoin (BTC) gave back most of last week’s gains in one violent move on Sunday, with the token slumping in value by over $500 in a very short timeframe and trading in a a$700 price range for the day. As with a lot of these spikes and slumps, there was no obvious reason for the move, although futures liquidation has been mooted. On Friday we warned that the weekend provides fertile ground for sharp price action,
“As always with this sector, sharp moves either way can occur in a short timeframe, and with the market trading 24/7, care should be taken over the weekend.”
IG client sentiment shows that retail customers are 83% net-long Bitcoin, a bearish contrarian indicator.

Bitcoin Bounces off Supportive Zone
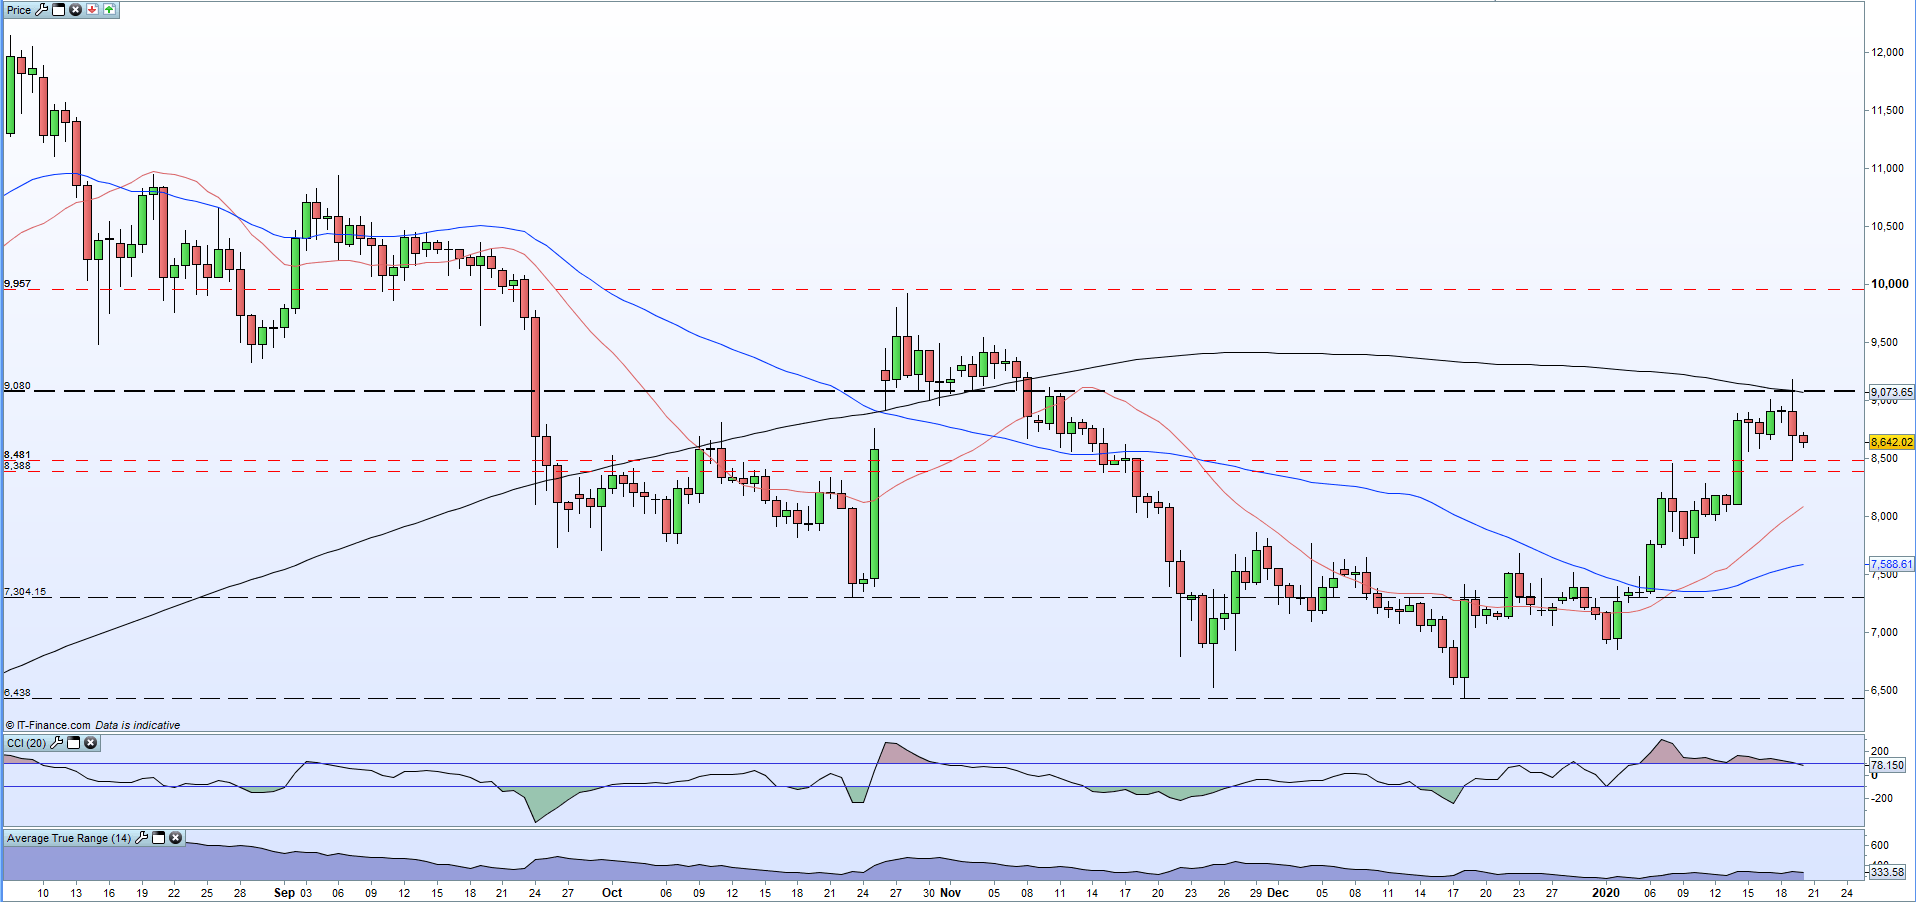
We mentioned recently that Bitcoin seems to have found a new support zone between $8,388 and $8,481 and this held over the weekend giving BTC a supportive bounce. The chart also shows that the 200-day moving average – currently at $9,073 - acted as resistance to the recent rally and this indicator will need to be broken and closed above if BTC is to rally further.The short-term pattern of higher lows remains in place despite the sell-off, although for BTC to break its series of lower highs it needs to trade above $9,935, the October 28 high.
Bitcoin (BTC) Daily Price Chart (August 2019 - January 17, 2020)
Traders may be interested in two of our trading guides – Traits of Successful Traders and Top Trading Lessons – while technical analysts are likely to be interested in our latest Elliott Wave Guide.
What is your view on the latest Bitcoin rally and crash? You can let us know via the form at the end of this piece or you can contact the author at nicholas.cawley@ig.com or via Twitter @nickcawley1.


