


FX Price Action Talking Points:
- The US Dollar is showing little for trend at the moment.
- Traders have two choices: Either be patient and wait for a break or look to trade smaller moves inside of recent swings.
The US Dollar remains in a, lets call it a ‘trendless’ state after recovering from the late-year sell-off. USD has displayed little trend-side direction of recent and prices continued that theme earlier this morning after getting a quick bump off of a near-term support zone. And given this lack of vol in the USD, many major pairs are in similar spots, trading inside of recent swings or ranges that leave little of interest for trend or breakout scenarios.
This leaves traders with two options: Either be patient and wait for potentially major moves to begin to show or, alternatively, work inside of those recent swings. I looked at a series of USD-pairs in this webinar in the effort of addressing each market appropriately.
US Dollar
Last week’s recovery in the US Dollar appears to have run its course although neither buyers nor sellers look ready to make a concerted push in USD price action. On a short-term basis, and looking inside of those swings, a hold of resistance around the 97.36 level can keep the door open for bearish USD-plays.
US Dollar Four-Hour Price Chart

Chart prepared by James Stanley; US Dollar on Tradingview
GBP/USD Threatens Bull Pennant Break
I had looked into this one earlier this morning and, amongst major pairs, this may be one of the more attractive scenarios that may lead to a ‘bigger picture’ break.
The bullish theme in Cable ran loudly through Q4 with aggressive bullish breakouts showing in October and December. After the December move, with price action finding resistance at 1.3000, prices ranged into December, at which point another breakout showed up. Since that one, however, price action has narrowed within a symmetrical wedge formation, making for a bull pennant. With buyers pushing prices up to trendline resistance, the door may soon open for continuation of that Q4 theme of GBP-strength.
| Change in | Longs | Shorts | OI |
| Daily | 1% | 2% | 2% |
| Weekly | -10% | 23% | 1% |
GBP/USD Daily Price Chart

Chart prepared by James Stanley; GBPUSD on Tradingview
EUR/USD
Going along with that lacking volatility in the USD, EUR/USD has remained in range for most of 2020 thus far. There may be a short-term bullish theme brewing, however, and this could keep the door open for short-term setups. Resistance at 1.1187-1.1212 shouldn’t be dismissed, and this could cap near-term topside targets.
| Change in | Longs | Shorts | OI |
| Daily | 3% | 2% | 2% |
| Weekly | -9% | 23% | 2% |
EUR/USD Four-Hour Price Chart
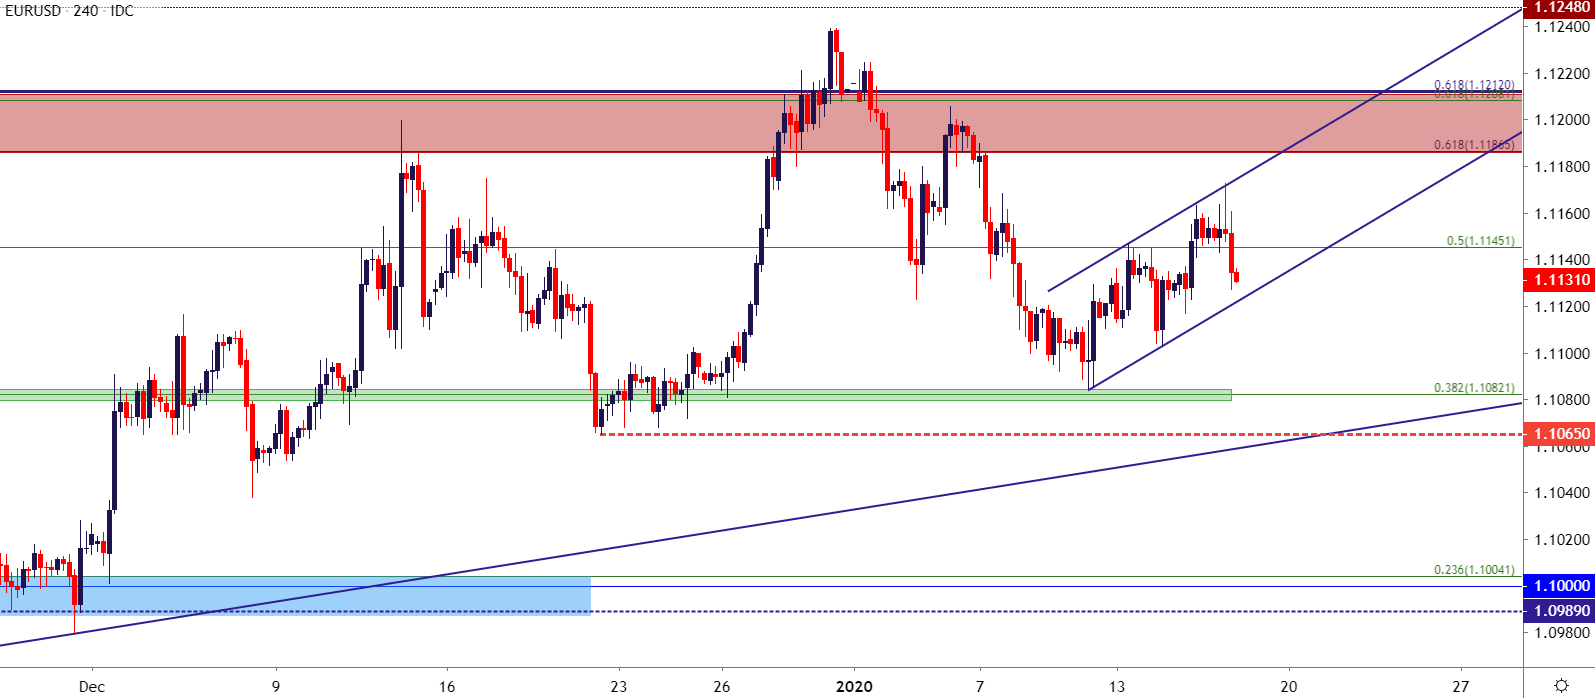
Chart prepared by James Stanley; EURUSD on Tradingview
USD/CAD – Canadian Inflation and Bank of Canada Next Wednesday
I mpasse may soon be ready to break in USD/CAD as next Wednesday brings a couple of high-impact drivers. Price action in the pair, at this point, is fairly equalized with little recent trend to work with. Strategy was discussed in the session, and this could be a big focal point for next week.
| Change in | Longs | Shorts | OI |
| Daily | -15% | 17% | 2% |
| Weekly | 40% | -15% | 0% |
USD/CAD Eight-Hour Price Chart

Chart prepared by James Stanley; USDCAD on Tradingview
AUD/USD
On the long side of the US Dollar, AUD/USD can remain attractive. Of importance is the level around .6930, which has been both recent resistance as well as short-term support from early 2020 trade. That price has been followed in the past few webinars for lower-high resistance, which may have shown up today. This can keep the door open for a push down towards .6850 after which the .6800 level becomes of interest.
| Change in | Longs | Shorts | OI |
| Daily | 7% | -3% | 3% |
| Weekly | -17% | 42% | -4% |
AUD/USD Daily Price Chart

Chart prepared by James Stanley; AUDUSD on Tradingview
--- Written by James Stanley, Strategist for DailyFX.com
Contact and follow James on Twitter: @JStanleyFX


