Bitcoin (BTC) Price Forecast, Analysis and Chart:
- CCI indicator shows Bitcoin heavily overbought in the short-term.
- Bitcoin hits its highest level since mid-November.
If you are interested in trading the cryptocurrency market, we have produced a Day Trading Guide to Bitcoin and Other Cryptocurrencies to help you better understand this highly volatile asset class.


Bitcoin (BTC) Rallies Over 23% in Less Than a Week
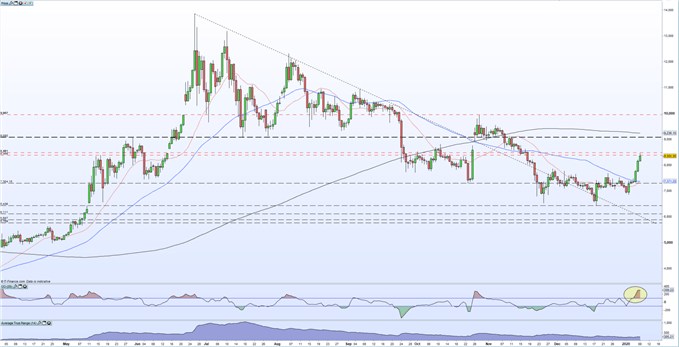
The dominant cryptocurrency, Bitcoin, has started 2020 with a surge, rallying in excess of 23%, low-to-high, since last Friday. This rally has also pulled other cryptocurrencies off their multi-week lows with double-digit gains commonplace. The daily chart now throws up a mixture of bullish and bearish signals over the short- and medium-term.
Using the CCI indicator, the latest rally has pushed Bitcoin into heavily overbought territory and may signal a pull back in the short-term as the market looks to gain some equilibrium. The CCI reading is at its highest level in nine months. Bitcoin remains below the 200-day moving average, but the spot price is quickly catching up this long-term indicator.
Positive signs remain however with BTC breaking sharply above both the 20- and 50-day moving averages at the start of the week, a sign that the medium-term sentiment is bullish. The pattern of lower lows started in late-June last year has also been broken. For further confirmation that Bitcoin’s bear market is over, a close above the October 28 lower high at $9,957 needs to be made. This would also take out the 200-dma currently at $9,238. The average true range (ATR) indicator has picked-up fractionally recently but remains well below levels seen in mid-July.
Bitcoin vs Gold: Top Differences Traders Should Know
Bitcoin (BTC) Daily Price Chart (April 2019 - January 8, 2020)

Traders may be interested in two of our trading guides – Traits of Successful Traders and Top Trading Lessons – while technical analysts are likely to be interested in our latest Elliott Wave Guide.
What is your view on Bitcoin (BTC) – bullish or bearish?? You can let us know via the form at the end of this piece or you can contact the author at nicholas.cawley@ig.com or via Twitter @nickcawley1.


