

USD/MXN Highlights:
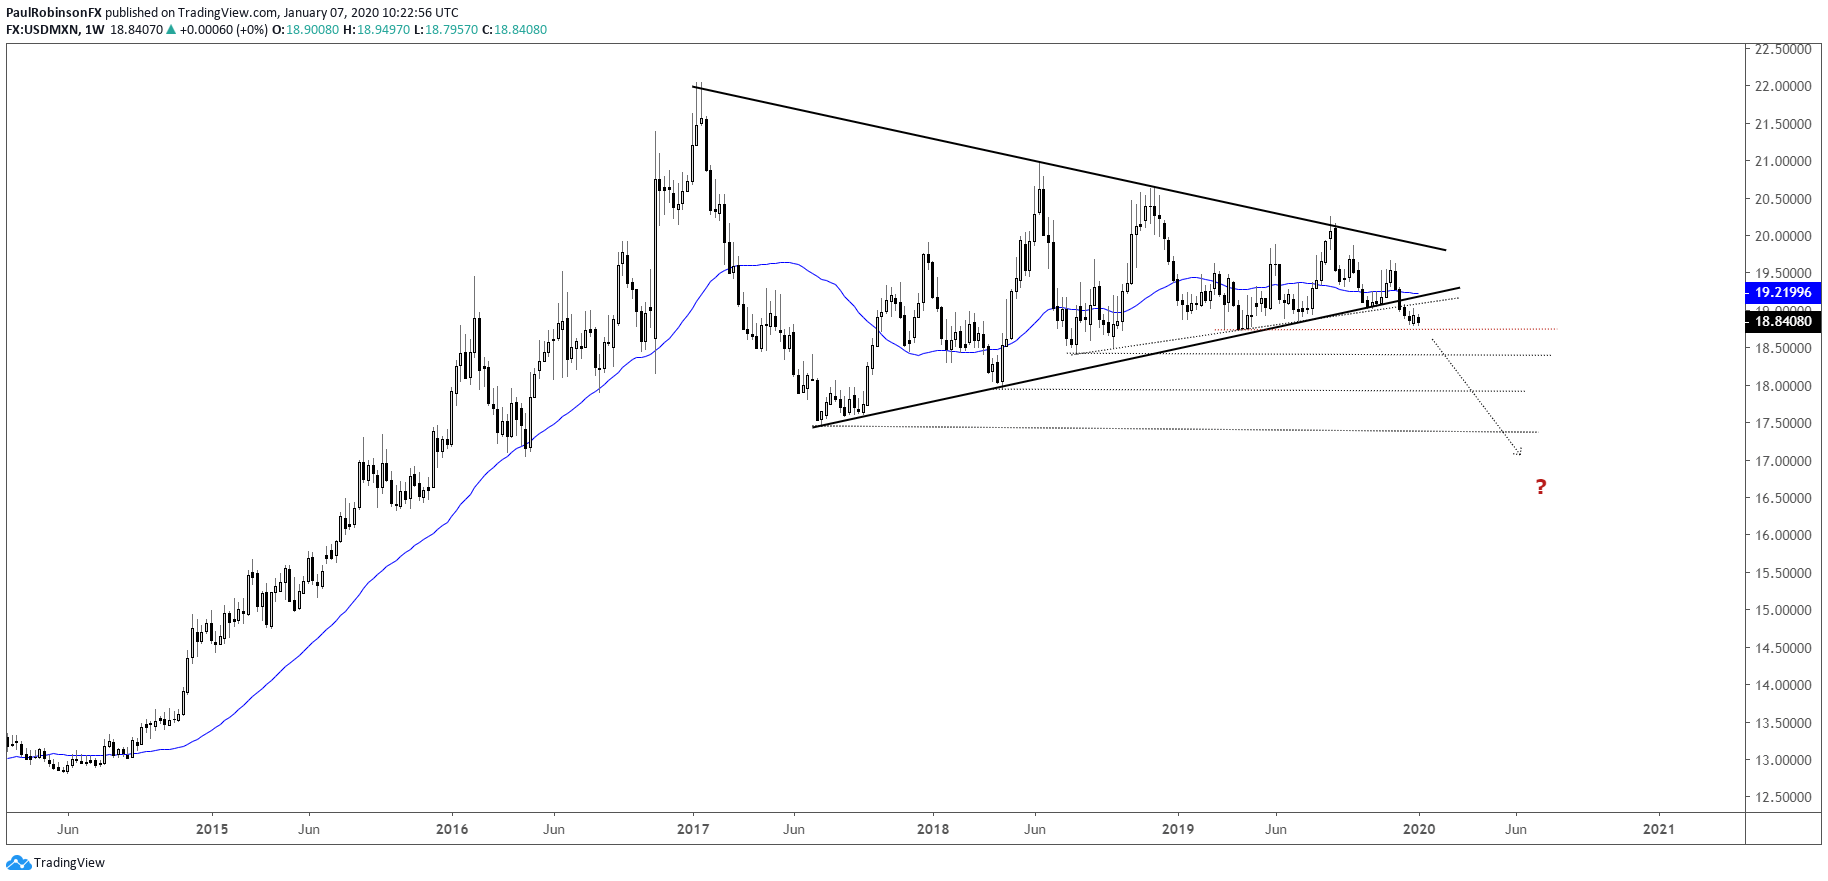
- USD/MXN big-picture triangle broke to end 2019
- A drop through 18.7433 need to give conviction
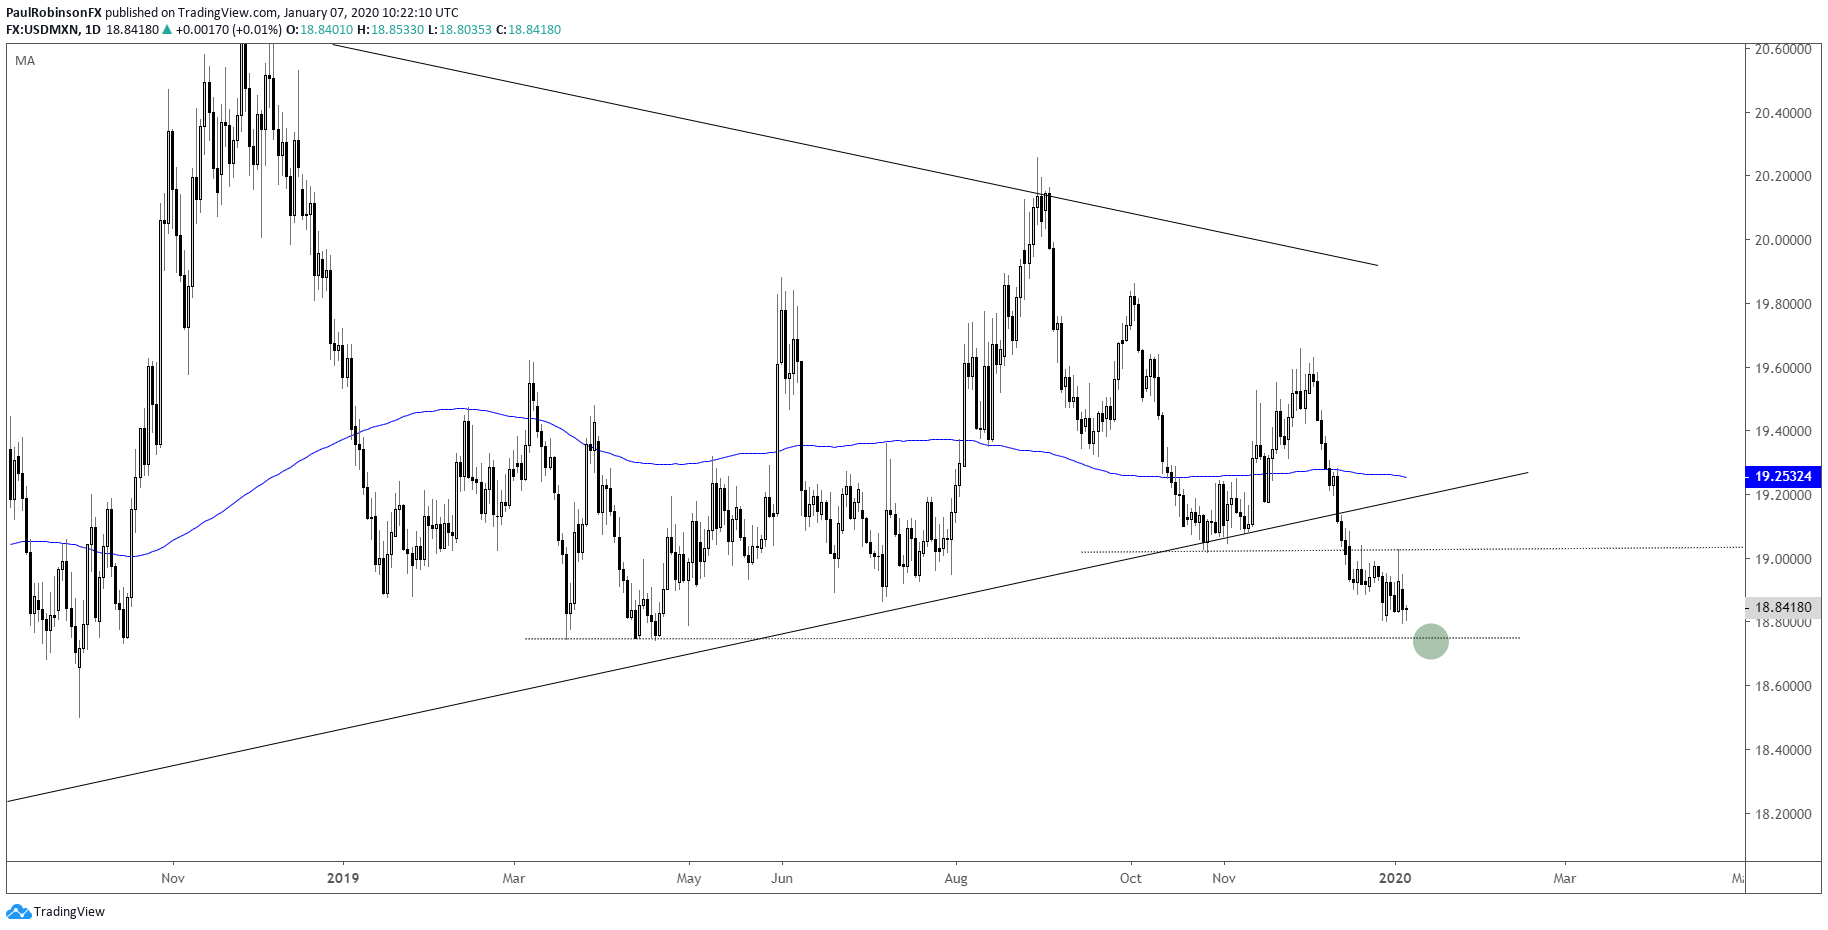
To end 2019, USD/MXN broke out of the three-year-long triangle it had been building as a result of declining volatility. The break so far has held minimal velocity which could change quickly if last year’s low at 18.7433 is broken. The lack of momentum could also mean we are in for a ‘fake-break’.
If indeed the decline out of the triangle is a false one that is soon to be reversed to the top-side, then it could come quickly if the yearly low holds. Waiting for a significant technical level (2019 low) to give-way post breakout from any type of pattern adds a layer of confirmation that can go a long way towards keeping traders out of trouble.
On weakness below 18.7433, if USD/MXN can start rolling downhill with force the size of the triangle back to the 2017 high/low suggests we would see a decline down towards the 15 level or worse at some point. It’s certainly a macro-target that will take some time to achieve, but along the way there should be plenty of opportunities for the short-term-minded trader.
On the flip-side, if the 2019 low holds and price starts to reverse higher, to invalidate the current breakdown a move beyond the top-side trend-line of the triangle will be required. A breakout above the trend-line running down from the 2017 high, after a false-break lower, could set into motion a strong rally. There is much work to be done, however, before having to concern ourselves with that outcome.

USD/MXN Weekly Chart (waiting for break below 2019 low)
USD/MXN Daily Chart (so far weak post-break, but need confirmation)
***Updates will be provided on the above thoughts and others in the trading/technical outlook webinars held at 1030 GMT on Tuesday and Friday. If you are looking for ideas and feedback on how to improve your overall approach to trading, join me on Thursday each week for the Becoming a Better Trader webinar series.
Resources for Forex & CFD Traders
Whether you are a new or experienced trader, we have several resources available to help you; indicator for tracking trader sentiment, quarterly trading forecasts, analytical and educational webinars held daily, trading guides to help you improve trading performance, and one specifically for those who are new to forex.
---Written by Paul Robinson, Market Analyst
You can follow Paul on Twitter at @PaulRobinsonFX