


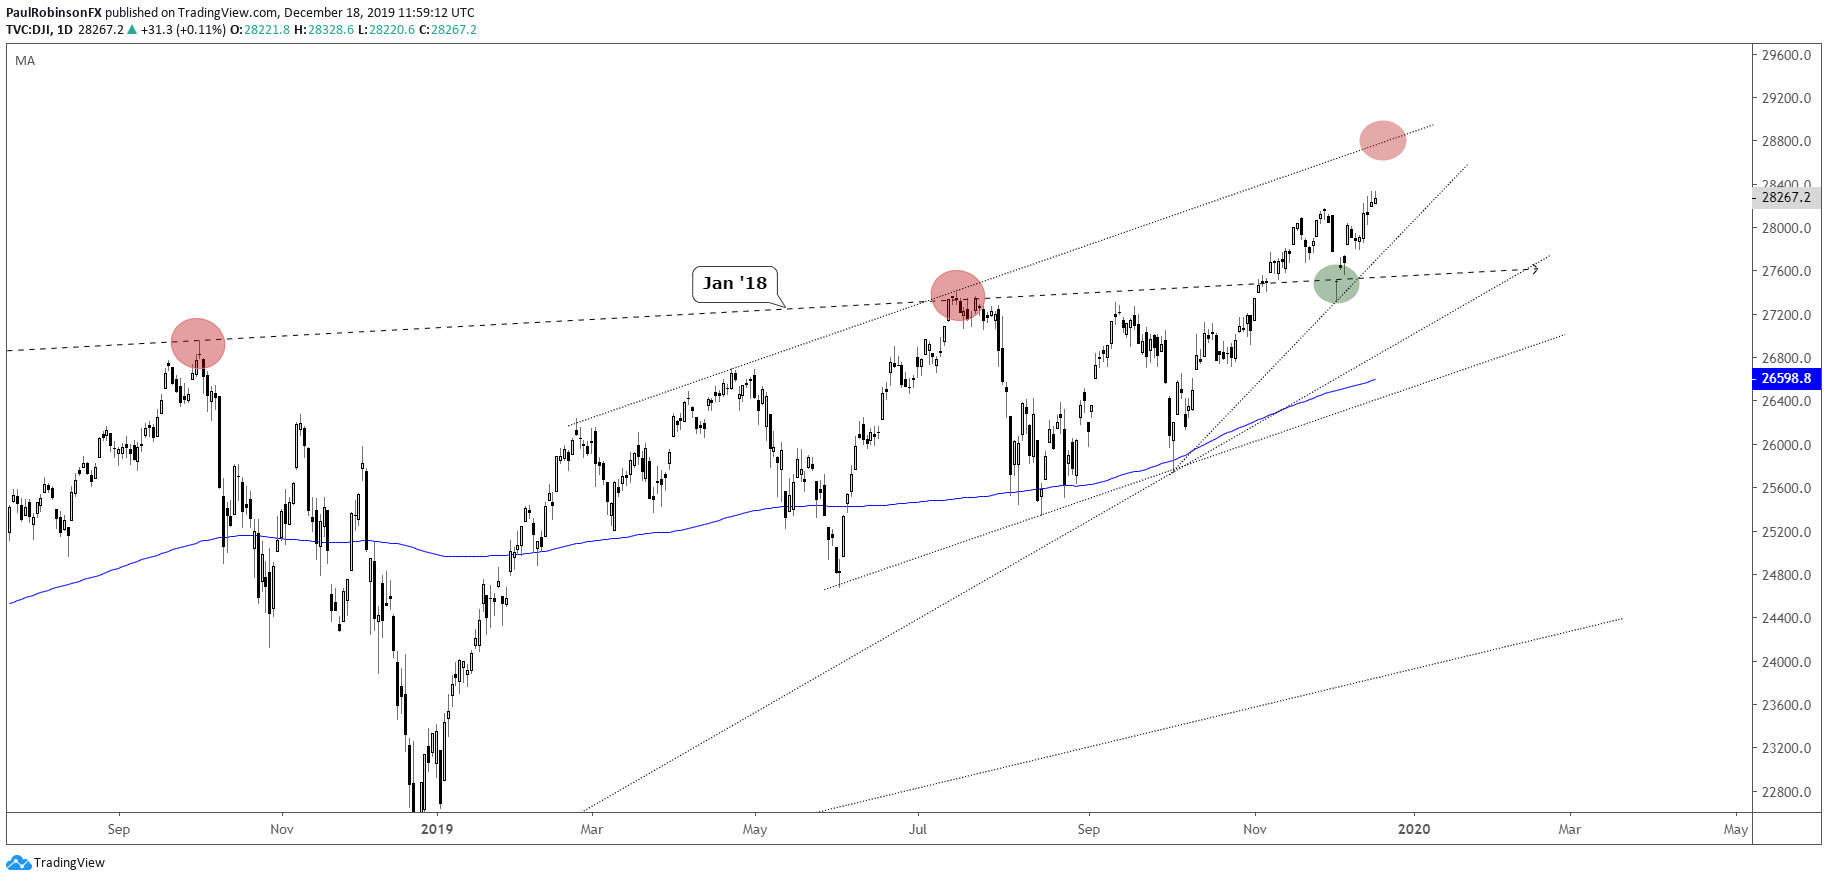
The Dow Jones continues to levitate as it treads in record territory. It’s a tough spot right now for those looking to establish fresh positions as the market could suffer a minor setback for new longs, but still too strong and without good risk thresholds for shorting.
This leaves existing longs from good prices still in good shape at the moment. There is a top-side trend-line running over as part of a broader channel. It currently clocks in around 28800 at the current trajectory, but is of course set to change with any delays. Support arrives via a trend-line from the October low, could give dip-buyers one last solid risk/reward opportunity before the calendar flips.

Dow Jones Daily Chart (watch upper slope, rising trend-line)
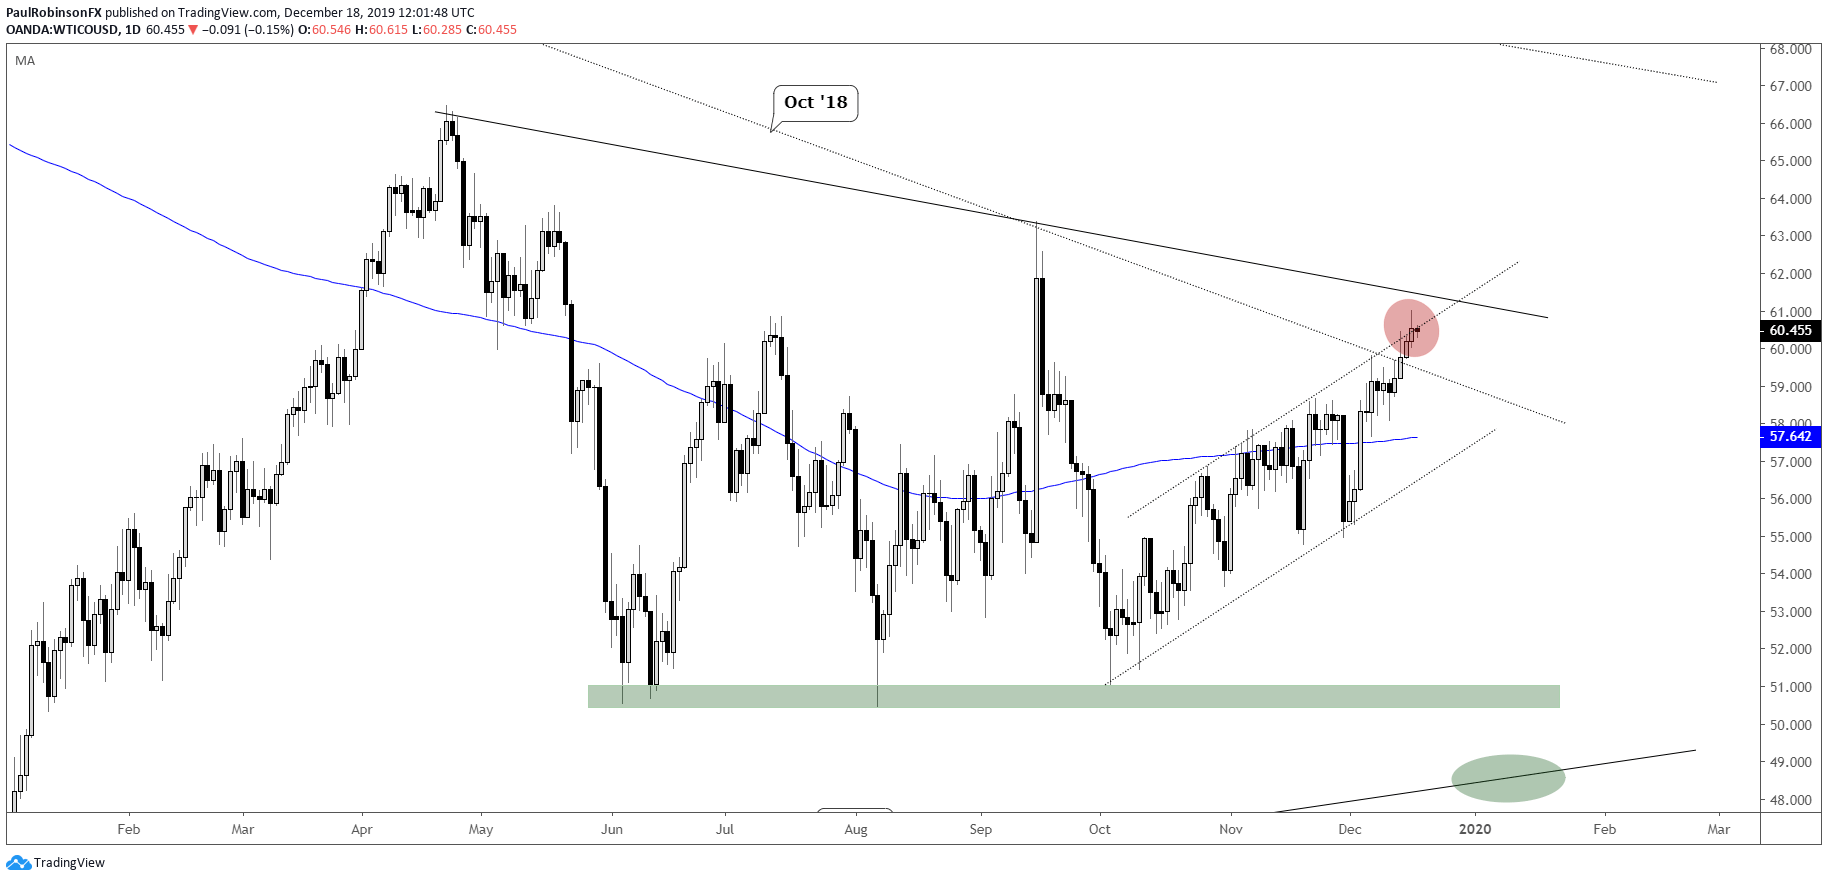
WTI crude oil has been very difficult to trade during the second-half of 2019, and that doesn’t look set to change at least until the new year arrives. Crude is currently up against a descending trend-line, and given recent price action the next step looks like it could be lower. But conviction is generally lacking at the moment, so sticking to the sidelines here might be the best bet (it’s been for a while…)
WTI Crude Oil Daily Chart (trend resistance, rising channel)
For the full set of technical details and charts, check out the video above…
Resources for Index & Commodity Traders
Whether you are a new or an experienced trader, DailyFX has several resources available to help you; indicator for tracking trader sentiment, quarterly trading forecasts, analytical and educational webinars held daily, and trading guides to help you improve trading performance.
We also have a series of guides for those looking to trade specific markets, such as the S&P 500, Dow, DAX, gold, silver, crude oil, and copper.
---Written by Paul Robinson, Market Analyst
You can follow Paul on Twitter at @PaulRobinsonFX


