


Copper, Trade Wars, HG Futures – TALKING POINTS
- Copper prices are trading at seven-month highs at 2.7920
- XCU/USD also recently broke above key June resistance
- Commodities rejoicing amid easing US-China trade risks
Copper Outlook Bullish
Copper prices have risen a little over 7.50% since reboundeding from the early-December swing-low at 2.6130 and are now trading at seven-month highs at 2.8135. However, negative RSI divergence is showing that upside momentum is fading along with signs that traders are not yet confident enough to trade above 2.8135.
However, a short-term bearish correction may be in the cards. The long wicks combined with the inability for the candle bodies to trade above resistance over the past few days signals a desire to continue higher but a lack of resolve. However, the multi-week/month outlook still supports a bullish bias, and this is also buttressed by the fundamental backdrop. But more on that later.
COMEX Copper Future (HG) – Daily Chart
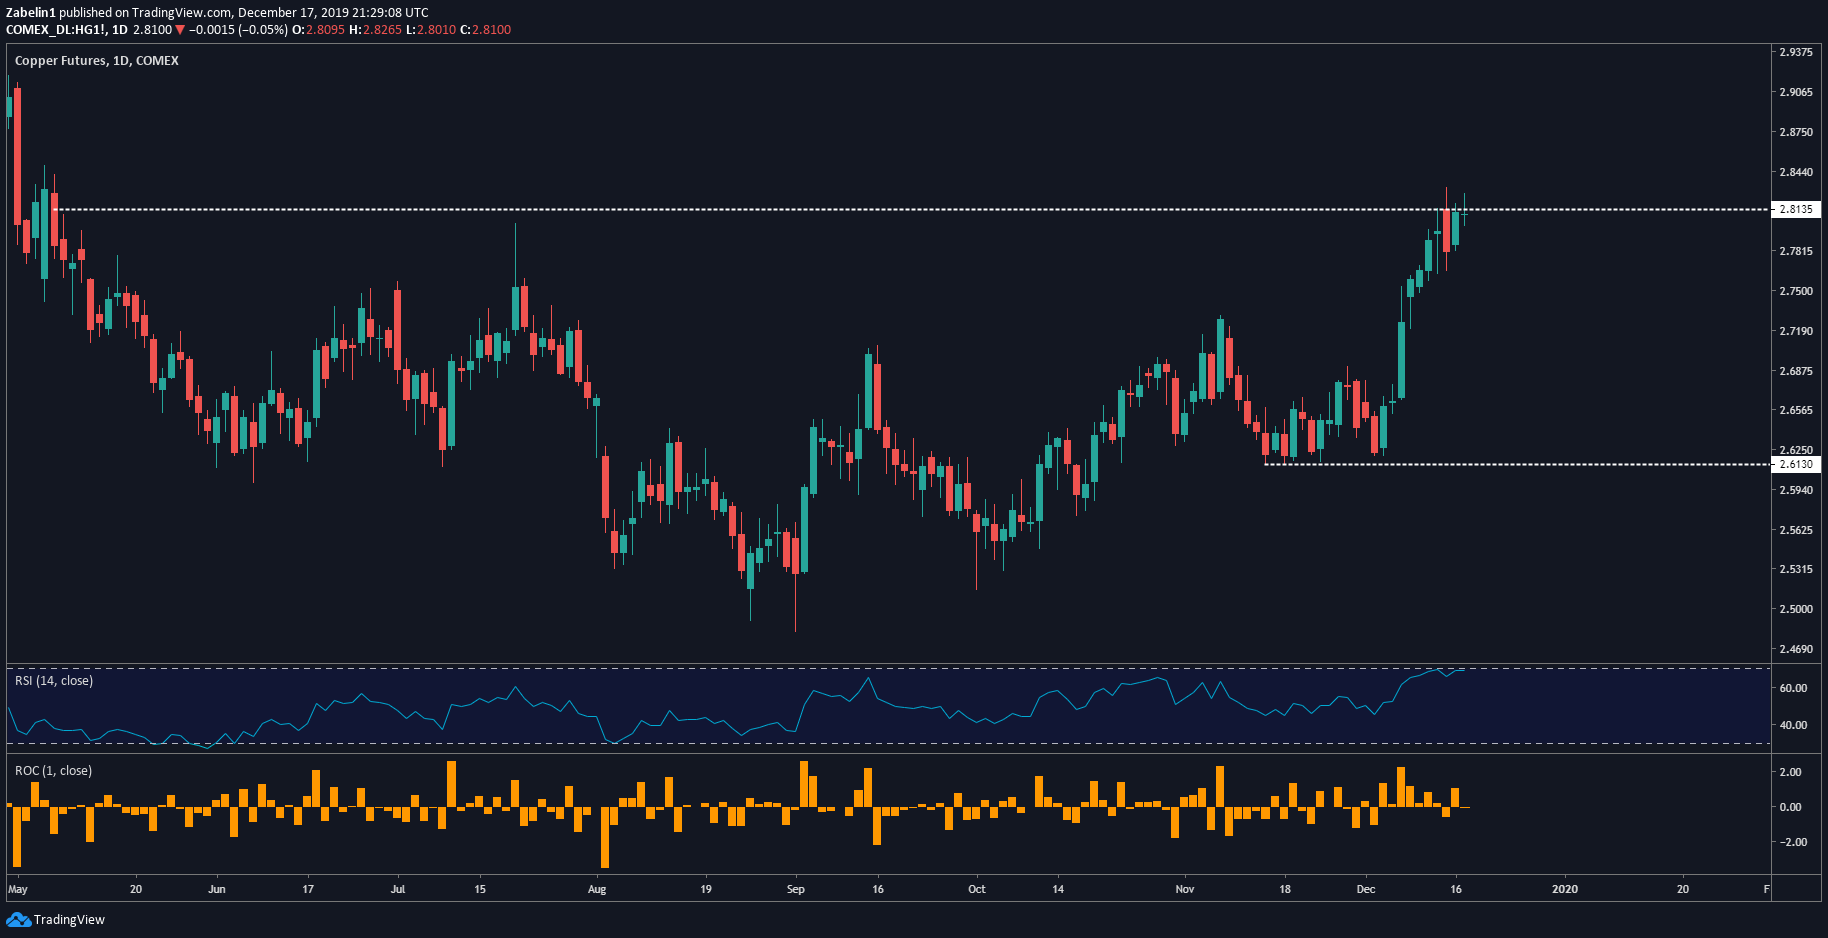
Copper chart created using TradingView
Looking at a weekly chart shows that the metal has also broken above the June descending resistance channel after a failed attempt in April, which was followed by an over-ten percent decline. If XCU/USD breaks above the ceiling and is met with follow-through it could mark the start of a bullish upswing until it hits resistance between 2.9545 and 2.9955.
COMEX Copper Future (HG) – Weekly Chart
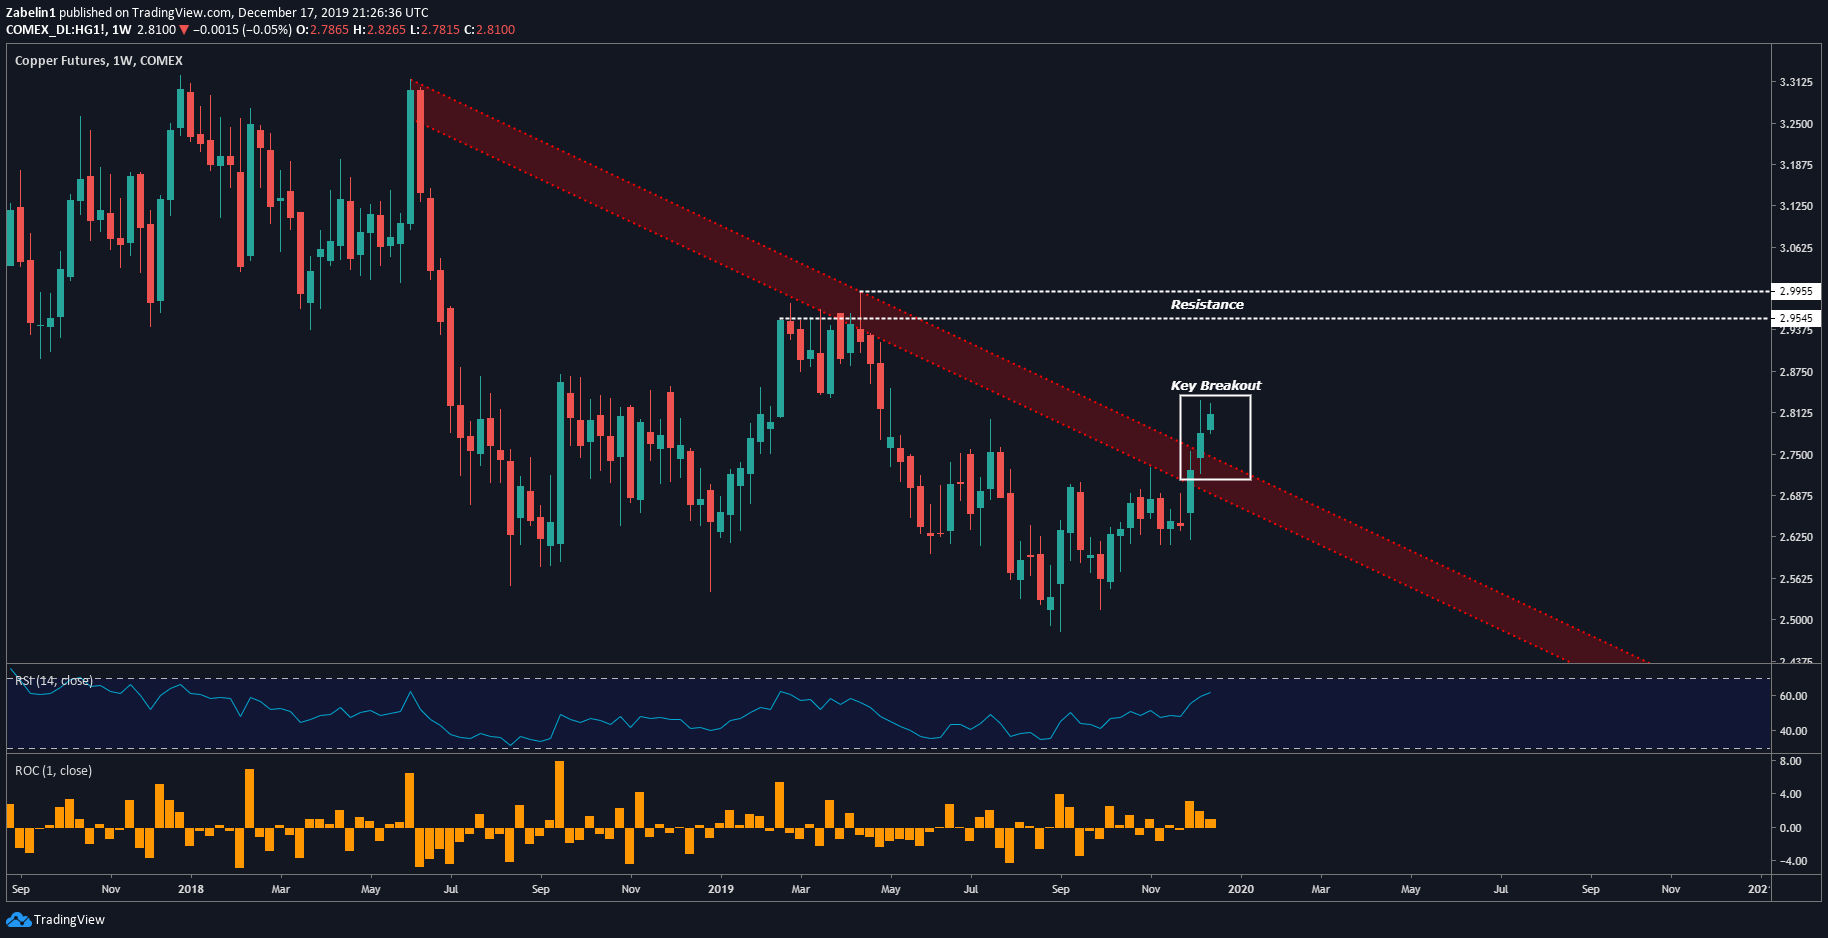
Copper chart created using TradingView
Copper Price Fundamental Analysis
In addition to the technicals, the fundamental outlook is also favorable for growth-sensitive commodities like copper. Renewed hopes about cooling tensions between Beijing and Washington combined with the completion of the “phase 1” deal has renewed risk appetite. Simultaneously it has also cooled rate cut expectations and the demand for anti-fiat hedges like gold has waned alongside them.
Copper to Gold Ratio, XAU/USD, 2020 Federal Funds Futures Contract – Daily Chart
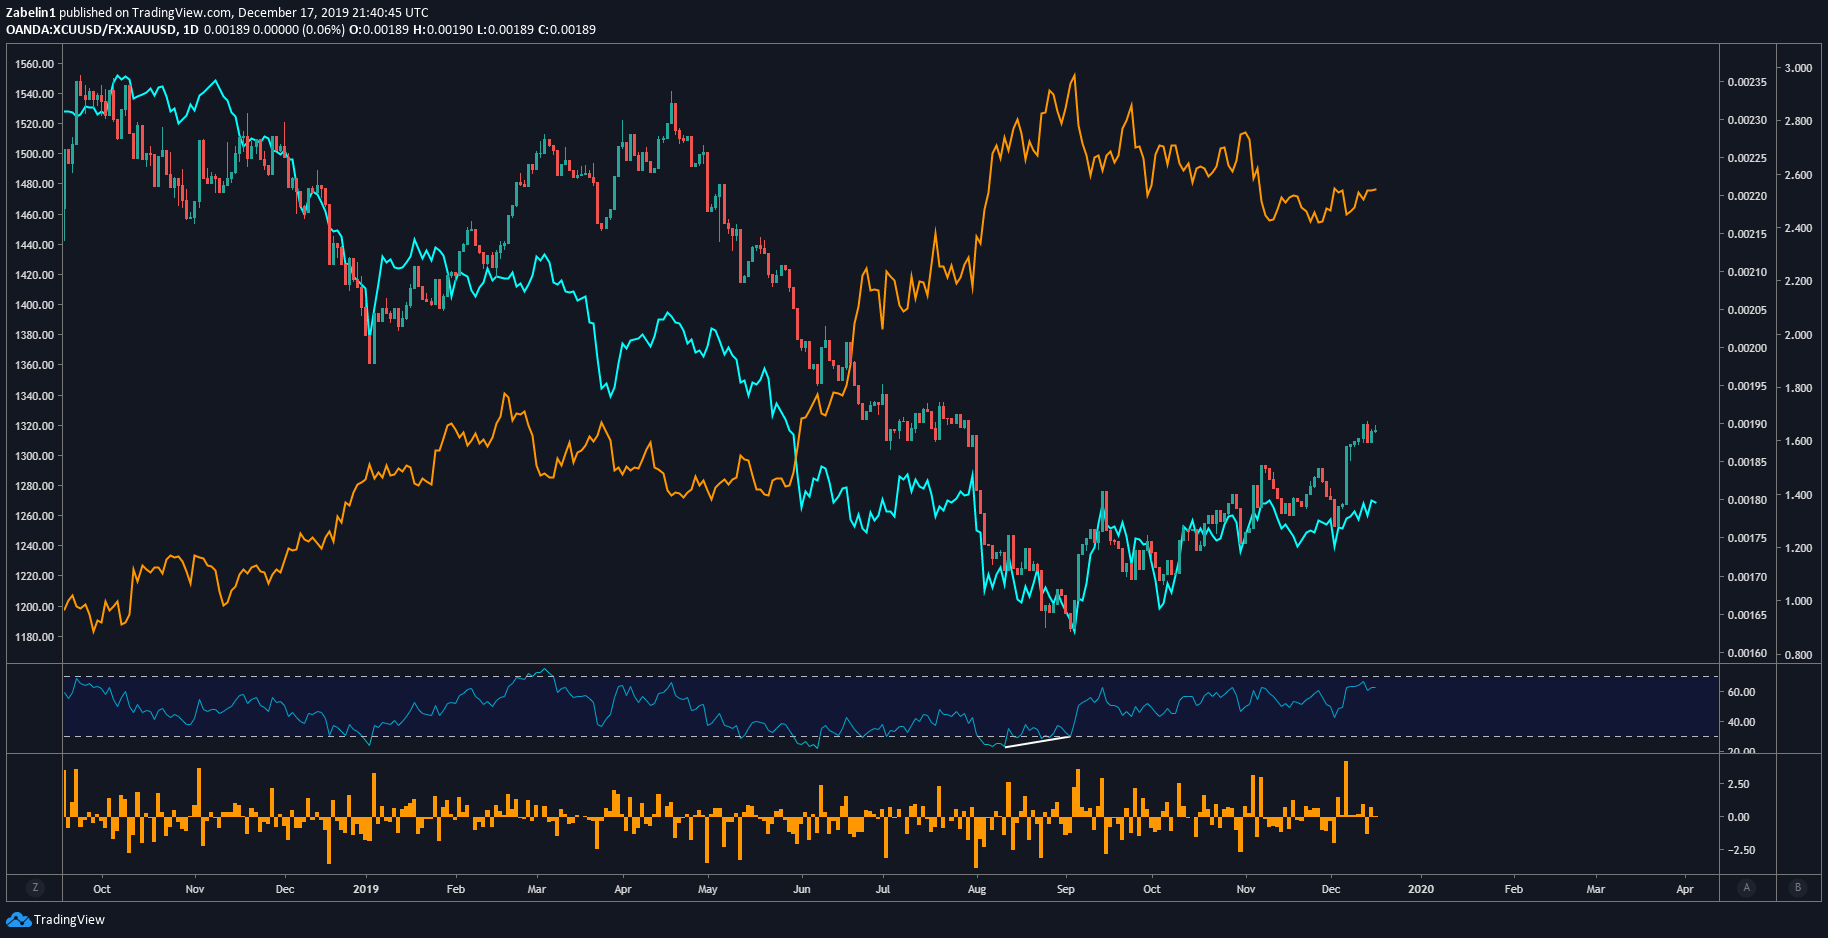
Copper to gold ratio chart created using TradingView
COPPER TRADING RESOURCES
--- Written by Dimitri Zabelin, Jr Currency Analyst for DailyFX.com
To contact Dimitri, use the comments section below or @ZabelinDimitri on Twitter


