


The US Dollar Index (DXY) is working its way lower towards an important support test. The lower end of the rising channel since 2018 could come into play as soon as today or early next week. For the Dollar to maintain its balance and keep grinding higher it will be important that the lower parallel holds up. If not, the flood gates could open to the downside. For now, will respect support for what it is and if a proper reaction occurs, the trading bias could shift back higher in the days ahead.
US Dollar Index (DXY) Daily Chart (important support)
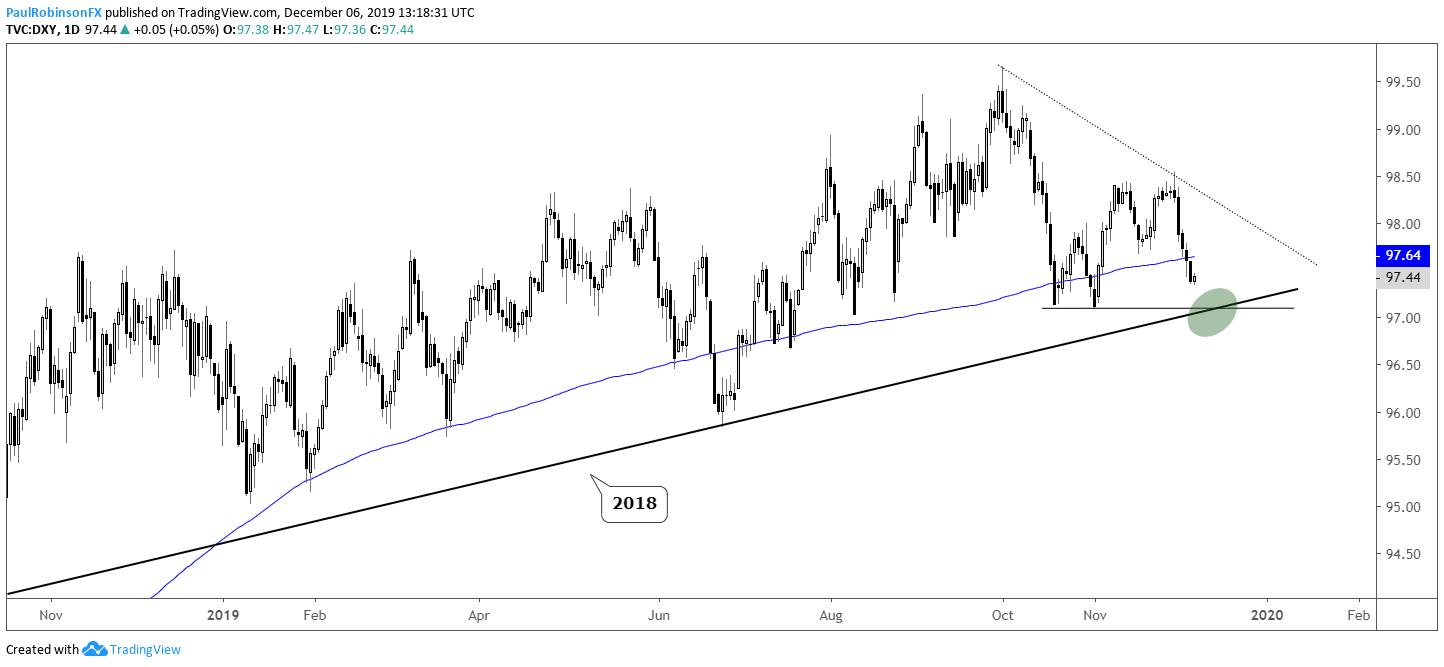
US Dollar Index (DXY) Chart by TradingView
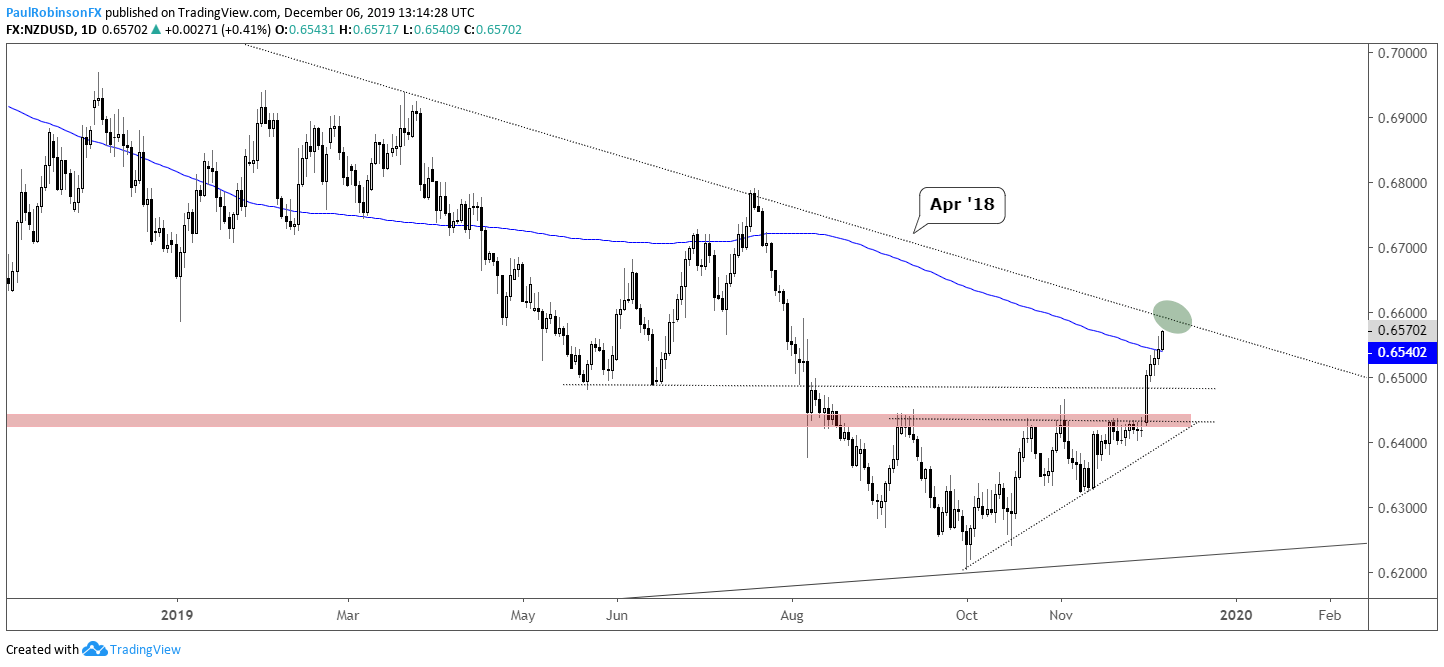
NZD/USD recently sprinted through resistance around the 6450-line, now trading above the 200-day MA. However, just ahead lies a big trend-line test from April 2018. For now, the momentum is strong, but close attention will need to be paid to how the market treats the trend-line. React lower or trade on through? Those with good prices from lower may want to consider seeing the reaction first before deciding to take action, while it may be prudent for would-be shorts to wait until bearish price action confirms the trend-line as resistance.
NZD/USD Daily Chart (watch price action at Apr ’18 t-line)
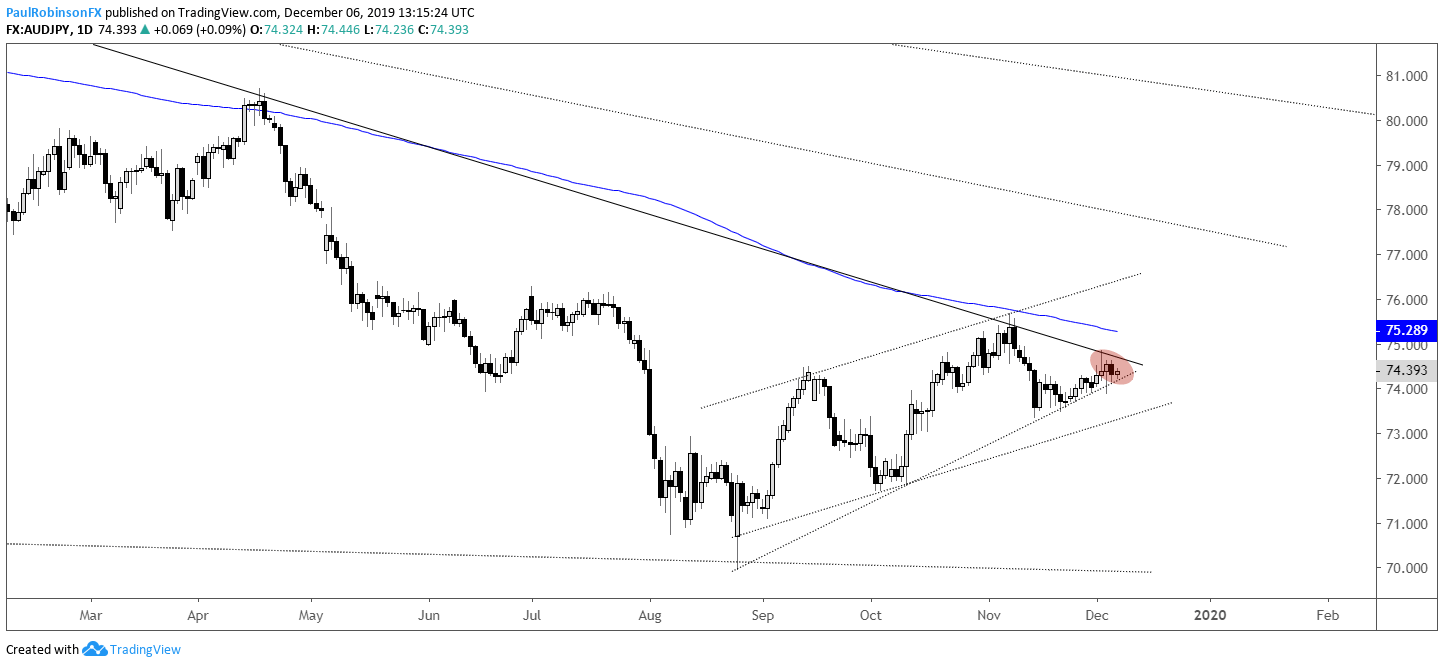
AUD/JPY is stuck in a tough spot right now. It has recently limped higher back to the trend-line from December of last year, but with that in mind, it is also supported by the trend-line off the August low. Looking at the 4-hr chart, we can see a channel forming. A break of the lower parallel could send AUD/JPY reeling again. A rise above the downtrend line will be needed to help firm up the outlook, but the falling 200-day MA will be another obstacle that has to be crossed.
AUD/JPY Daily Chart (stuck between trend-lines)
AUD/JPY 4-hr Chart (channel)

For the full set of technical details and charts, check out the video above…
Resources for Index & Commodity Traders
Whether you are a new or an experienced trader, DailyFX has several resources available to help you; indicator for tracking trader sentiment, quarterly trading forecasts, analytical and educational webinars held daily, and trading guides to help you improve trading performance.
We also have a series of guides for those looking to trade specific markets, such as the S&P 500, Dow, DAX, gold, silver, crude oil, and copper.
---Written by Paul Robinson, Market Analyst
You can follow Paul on Twitter at @PaulRobinsonFX


