


EUR/USD Price Forecast, Analysis and Chart:
Brand New Q4 2019 USD and EUR Forecast and Top Trading Opportunities
EUR/USD Price Analysis and Forecast
EUR/USD sits just above 1.1000 with recent price action suggesting a test lower in the coming days. Any attempt to push higher has been met with selling and the chart continues to indicate that negative sentiment holds sway. Later today the first look at US durable goods orders for October and the second look at Q3 GDP. Both data sets are released at 13.30 GMT. Later in the afternoon session, the Fed’s preferred measure of inflation, PCE, is released at 15.00 GMT. All these high importance events may move the US dollar with any show of strength in the US economy likely to push EUR/USD lower. Any weakness in the data may stem the move lower in EUR/USD in the short-term but it is unlikely to see the pair move higher.

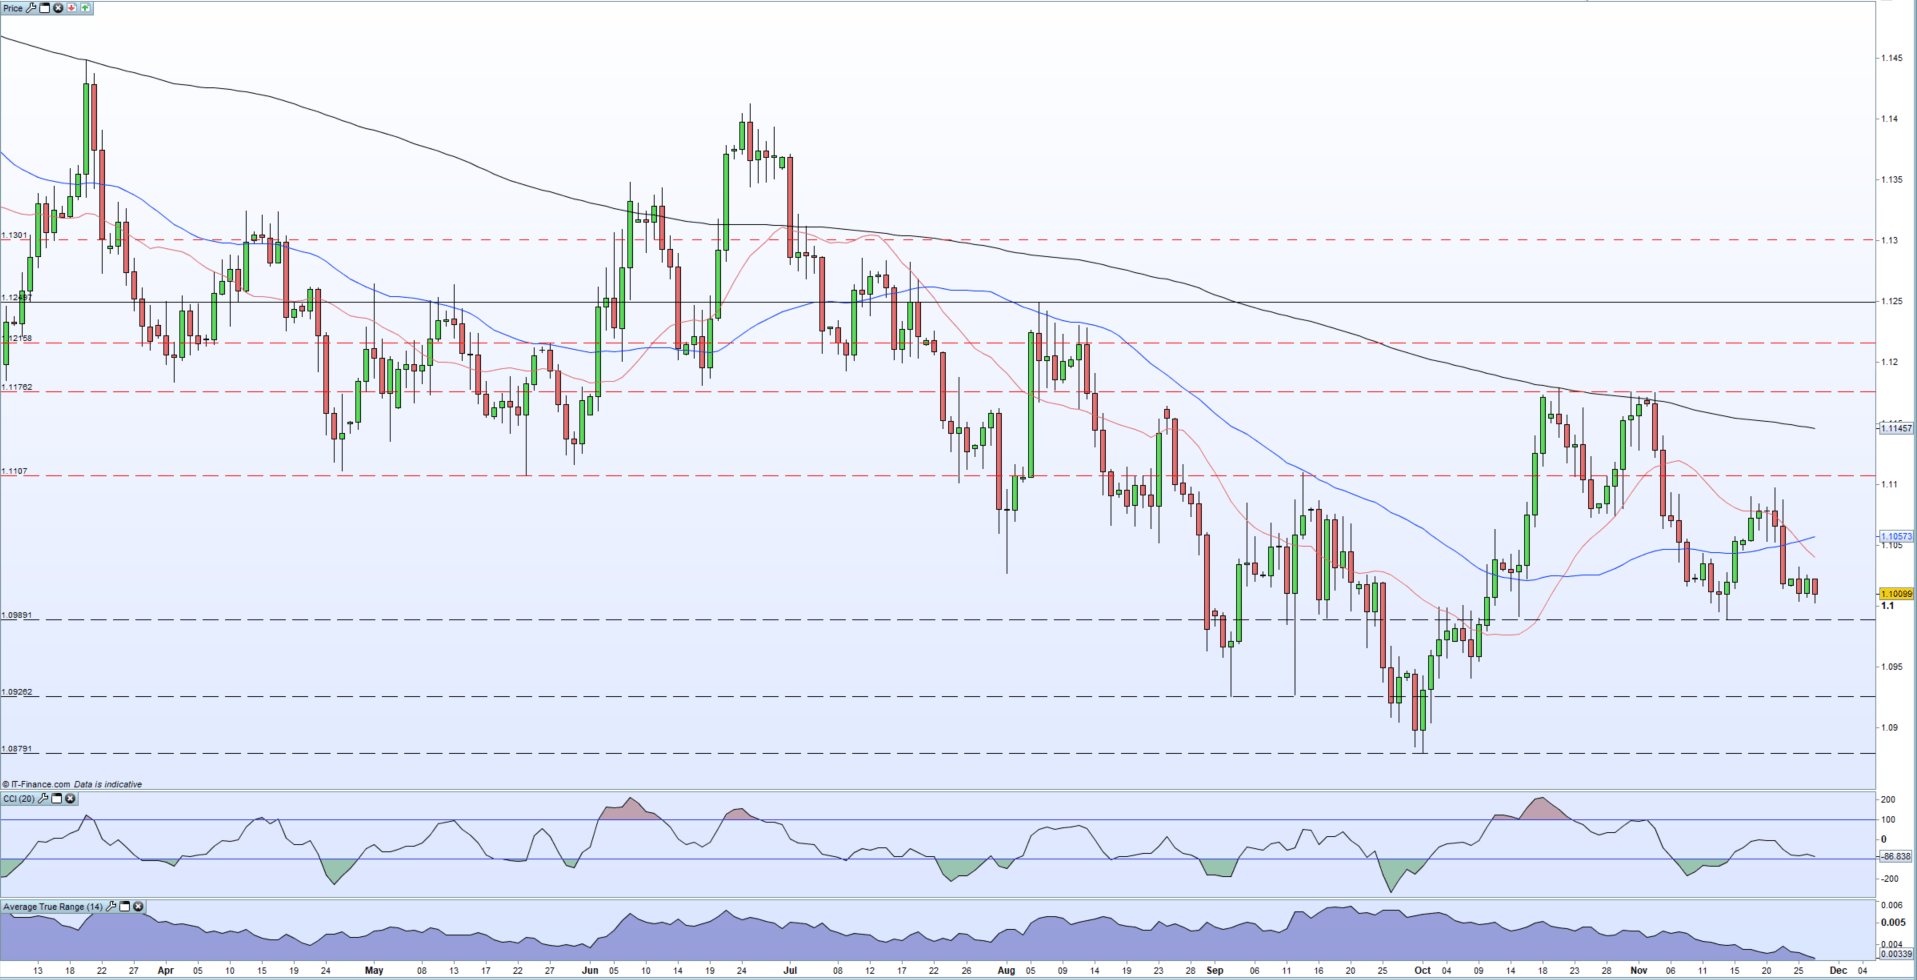
The daily chart shows the current EUR/USD negative set-up and points to lower prices. The pair trade below all three moving averages, with the 20-dma now trading below the 50-dma adding further short-term pressure on the EUR/USD. The CCI indicator is drifting lower and may soon enter oversold territory, which may slow any downside momentum. Initial support at 1.0989 ahead of 1.0926 and the October 1 low at 1.0879. Below here the pair will be trading at lows last seen in May 2017. To the upside a range of recent highs, and the 20-dma and 50-dma, block the way back to 1.1100.
AT the bottom of the chart, the Average True Range indicator shows that volatility in EUR/USD is at multi-month low levels, with the current daily range at just 34 ticks, making trading the pair difficult at the present time.
Using ATR to Adapt to Dynamic Conditions in the Forex Market
The IG Client Sentiment shows that traders are 57% net-long EUR/USD, giving us a bearish contrarian bias.The latest Commitments of Traders (CoT) report shows professional traders and speculators raising heir long positions in the US dollar and while net-short Euro positions increased.
US Dollar Buying Persists, CAD Longs Capitulate – CoT Report
EUR/USD Daily Price Chart (March - November 27, 2019)
Traders may be interested in two of our trading guides – Traits of Successful Traders and Top Trading Lessons – while technical analysts are likely to be interested in our latest Elliott Wave Guide.
What is your view on the Euro and the US Dollar – bullish or bearish?? You can let us know via the form at the end of this piece or you can contact the author at nicholas.cawley@ig.com or via Twitter @nickcawley1.


