


Bitcoin (BTC) Price Forecast, Analysis and Chart:
- Old horizontal support around $6,500 stems recent downside.
- Technical outlook remains negative and a 5-handle is not out of the question.
If you are interested in trading the cryptocurrency market, we have produced a Day Trading Guide to Bitcoin and Other Cryptocurrencies to help you better understand this highly volatile asset class.
Bitcoin (BTC) Continues to Crumble
The cryptocurrency sell-off continues with Bitcoin probing six-month lows over the weekend. We warned over the last couple of weeks that the technical outlook for Bitcoin was negative, and even after these heavy falls, the outlook remains for lower prices in the medium-term. One of the main fundamental drivers over the last few days was the recent crackdown by Chinese authorities on illegal platforms, with rumors – swiftly denied - extending to some of the more established exchanges. Either way, the market remains fragile and pointed lower.
Bitcoin (BTC) Price Remains Under Technical Pressure as $8,000 Looms
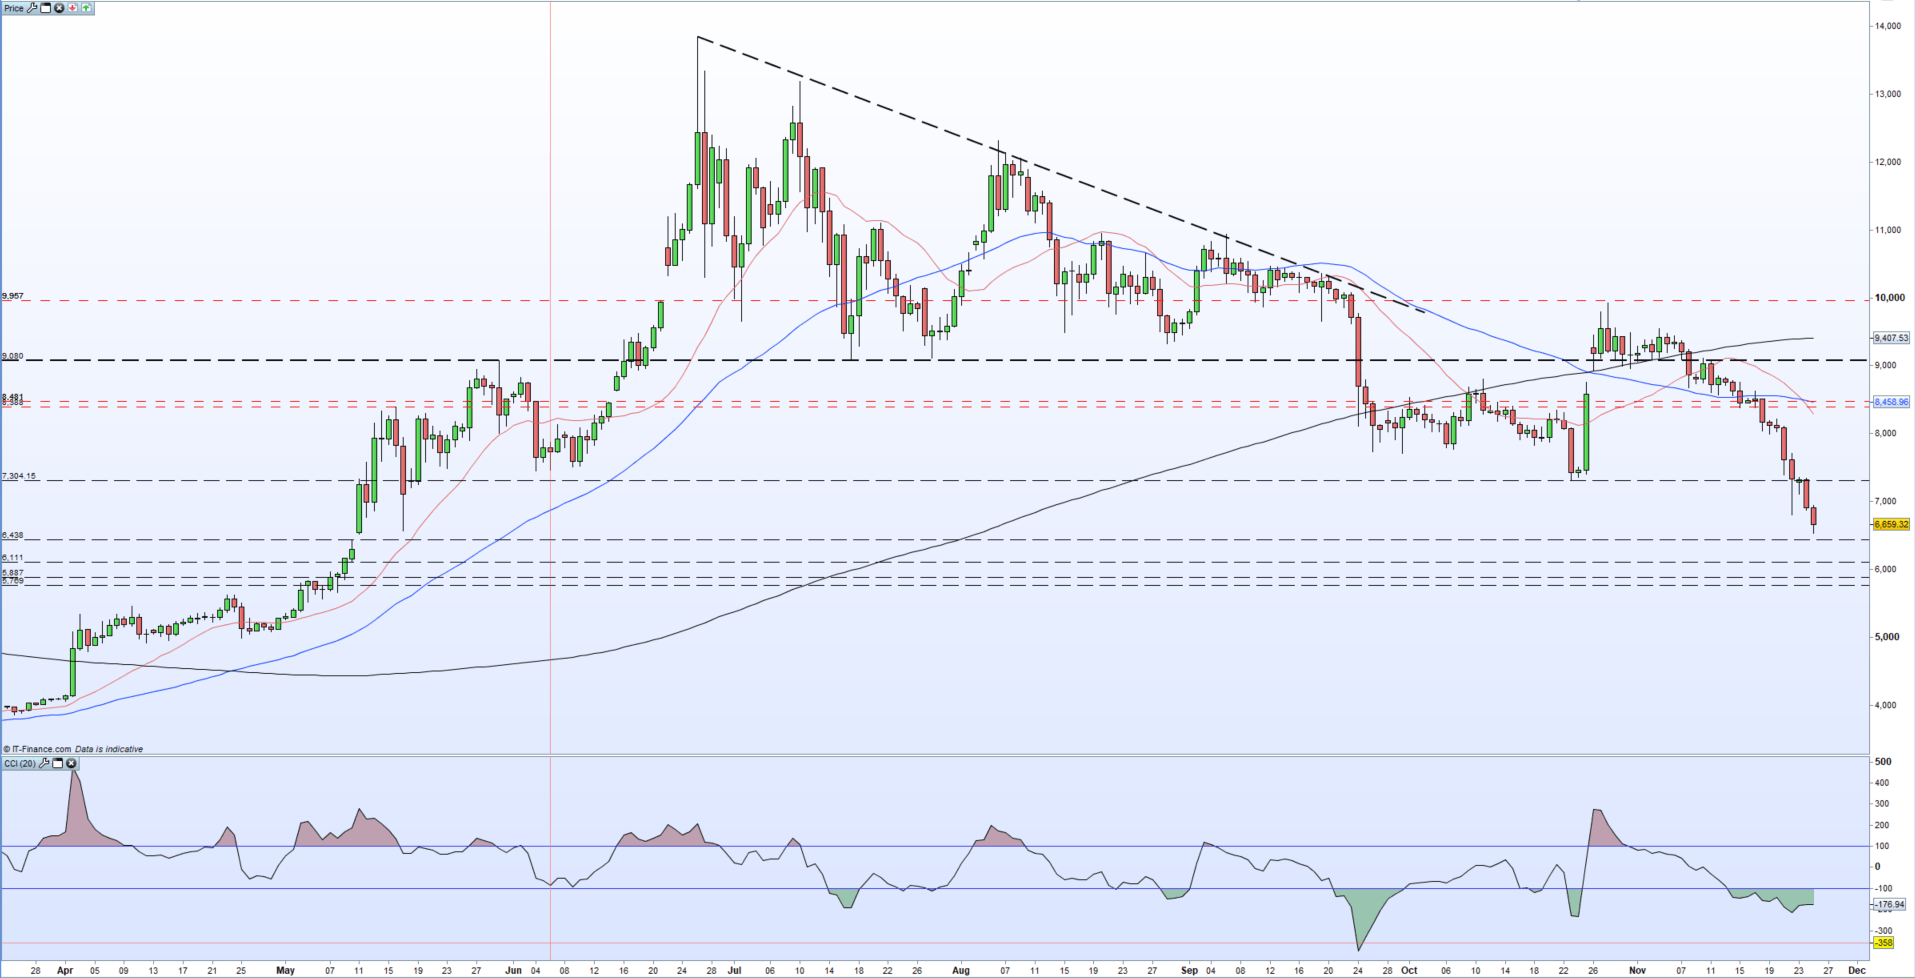
A look at the daily chart shows that horizontal support at $7,310 was unable to stem the sell-off with the price trading all the way back down to $6,520, another old zone of horizontal support from back in mid-May. This level may hold in the short-term, with Bitcoin re-testing $7,300. However, if BTC is unable to confirm a close above $7,300 the downside will come back into play. Below $6,500, there is little in the way of support and a sustained sell-off may see the April 2 bull candle back in play. This would see Bitcoin trading back below $4,770.
The technical outlook remains medium-term negative with BTC trading below all three moving averages. BTC may get a short-term bid off the CCI indicator which shows Bitcoin trading in oversold territory.
Bitcoin (BTC) Daily Price Chart (March – November 25, 2019)
IG Client Sentiment shows that retail traders are 85% net-long Bitcoin, a bearish contrarian bias.
Traders may be interested in two of our trading guides – Traits of Successful Traders and Top Trading Lessons – while technical analysts are likely to be interested in our latest Elliott Wave Guide.
What is your view on Bitcoin (BTC) – bullish or bearish?? You can let us know via the form at the end of this piece or you can contact the author at nicholas.cawley@ig.com or via Twitter @nickcawley1.


