


The Dow Jones had a hint of weakness yesterday, but nothing too pervasive as the trend continues to be quite strong. Even as such, though, there is room for a decline as the market is a bit extended right now. There is a steep trend-line rising up from the October low, but may not be sufficient to keep price supported.
The top-side trend-line from January 2018 is the targeted objective on weakness, and depending on how price action plays out it could be a spot for dip-buyers. A gradual pullback will be viewed as bullish, needing a strong move lower to rev up the motor for shorts.
Dow Jones Daily Chart (on a pullback watch 2018 t-line as support)

Dow Jones Chart by TradingView
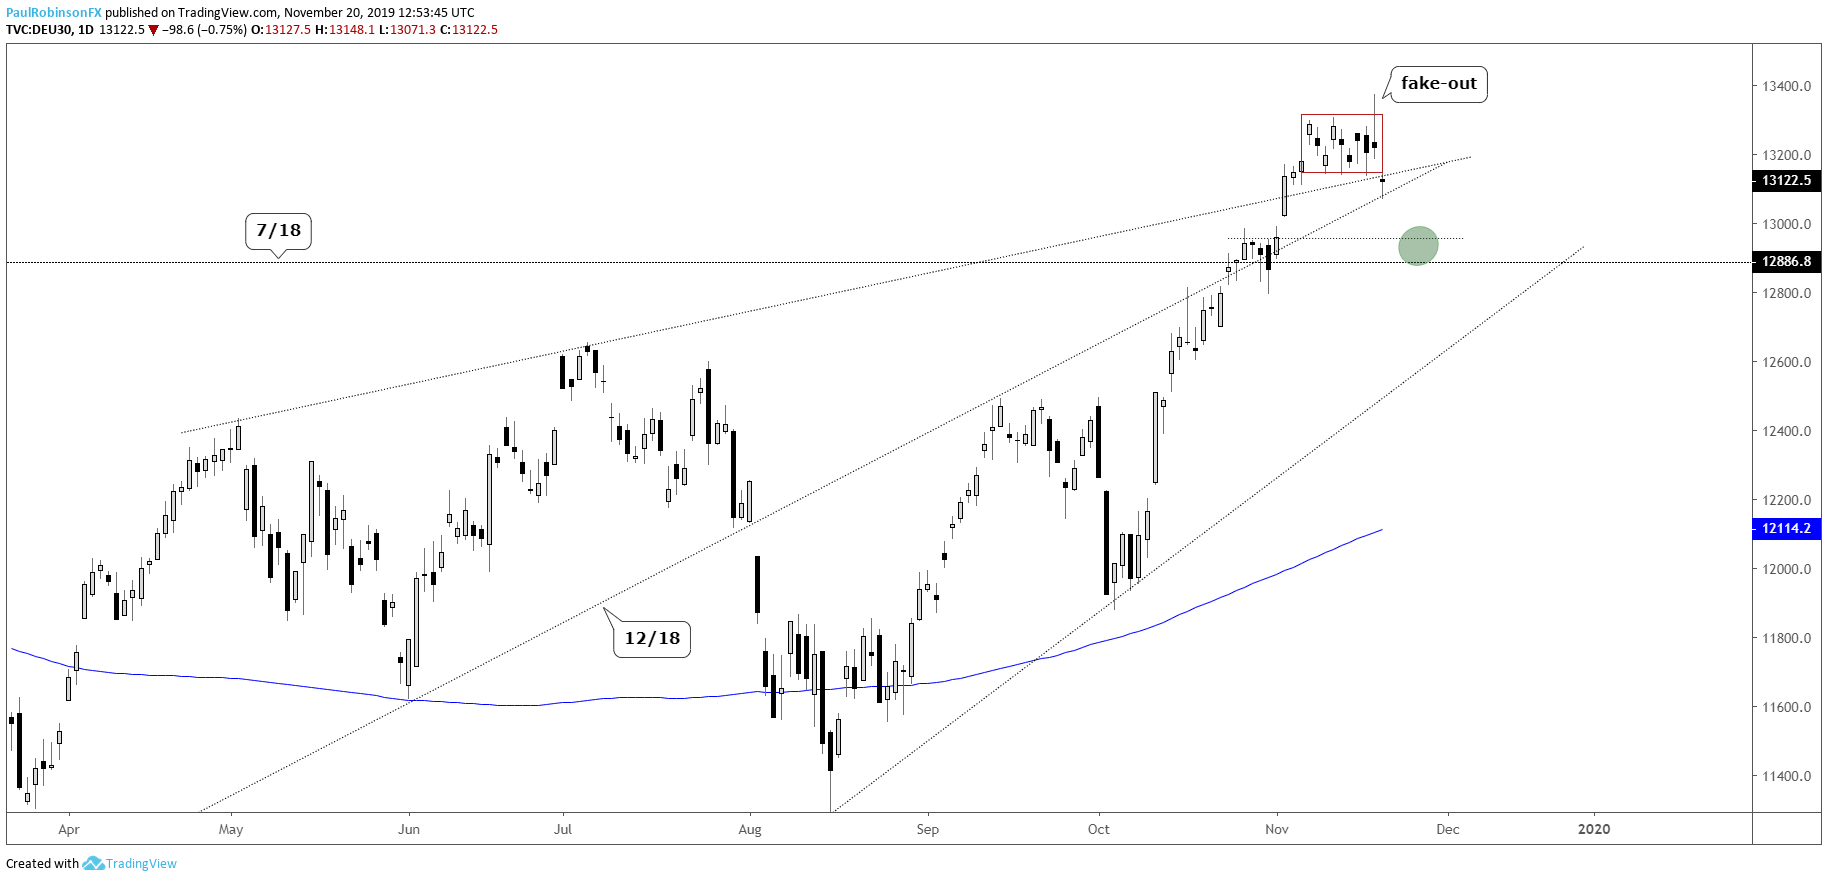
Yesterday, the DAX was trading above a high and tight consolidation pattern before reversing course and posting a bearish reversal that signaled a fake-out breakout. This set it up for today’s weakness which has the market below the bottom of the recent range. There is support, however, rising up via the slope off the December low. This may keep the market held up, but if it doesn’t then look for weakness to continue towards sub-13000, a gap-fill at 12961.
DAX Daily Chart (fake-out sets up weakness)
Crude oil took a bit of hit yesterday, which has price sitting on a minor level of support. A breakdown could have the US & UK contracts reeling towards support levels from the months before. For more in-depth commentary check out this morning’s piece – Crude Oil Price Outlook: Bears Show Teeth, Technical Break Near Confirmation.
Gold is coming off support under 1450, but not doing so with a whole lot of strength yet. This could set it up for another round of selling soon towards the lower parallel of a bull-flag that has been building since topping in September at key levels from the 2011/12 topping process.
For the full set of technical details and charts, check out the video above…
Resources for Index & Commodity Traders
Whether you are a new or an experienced trader, DailyFX has several resources available to help you; indicator for tracking trader sentiment, quarterly trading forecasts, analytical and educational webinars held daily, and trading guides to help you improve trading performance.
We also have a series of guides for those looking to trade specific markets, such as the S&P 500, Dow, DAX, gold, silver, crude oil, and copper.
---Written by Paul Robinson, Market Analyst
You can follow Paul on Twitter at @PaulRobinsonFX


