


Bitcoin (BTC) Price Forecast, Analysis and Chart:
- Bitcoin’s technical continues to show a negative bias.
- October low remains in sight.
If you are interested in trading the cryptocurrency market, we have produced a Day Trading Guide to Bitcoin and Other Cryptocurrencies to help you better understand this highly volatile asset class.
Bitcoin (BTC) Price Steadily Drifting Lower
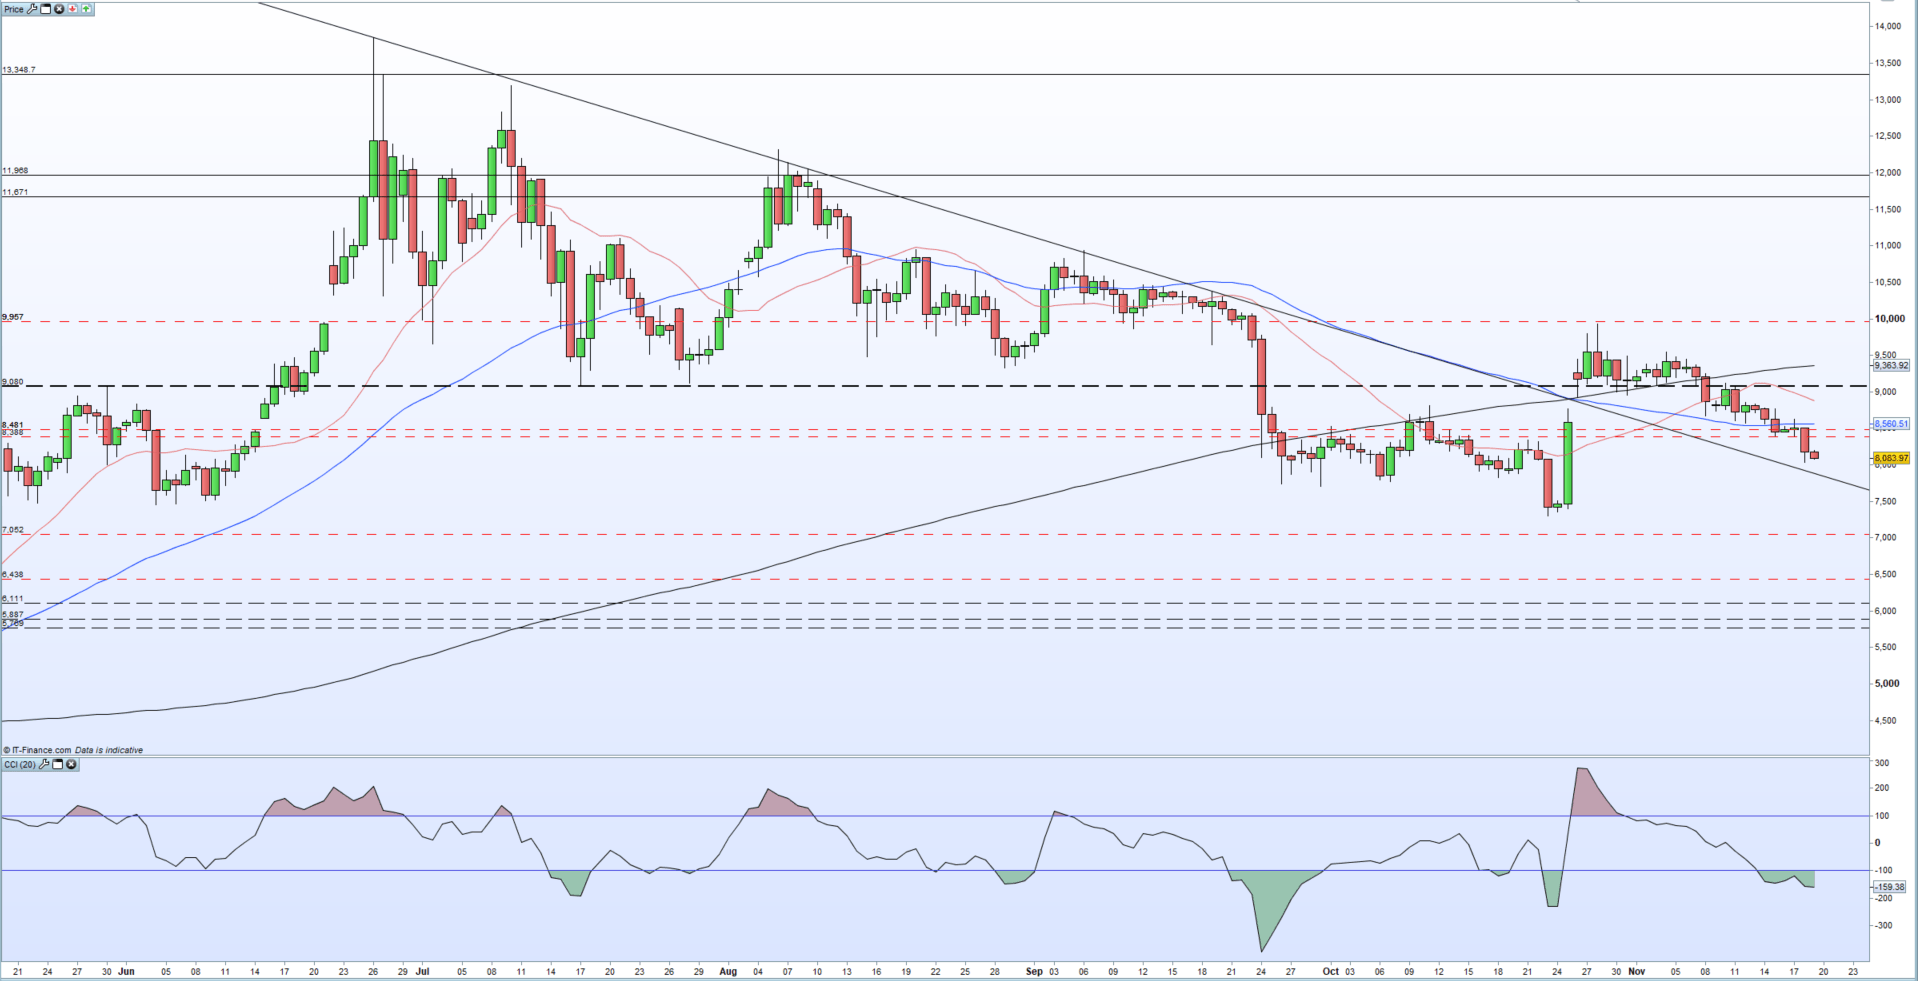
Bitcoin continues its grind lower and has lost 15% in value over the last two weeks as sellers remain in control of price action. We noted the recent death cross formation in late-October - 50-dma trading down through the 200-dma – and little has changed to bolster the largest cryptocurrency.
Bitcoin (BTC) Price Struggle Continues, Mired by Conflicting Signals.
BTC has also fallen below all three moving averages, a negative chart signal, and there is little in the way of support until the October 23 low at $7,300. The downtrend off the June 22 high may offer short-term support, currently situated at $7,880, but a confirmed close below this line should see the price fall back to the recent low print. The CCI indicator shows Bitcoin in oversold territory, while IG Client Sentiment shows that retail traders are 84% net-long Bitcoin, a bearish contrarian bias.
Bitcoin’s Average True Range – a volatility measure of buying and selling pressure – is close to a multi-month low, highlighting the lack of trading activity in the market. It should be noted that cryptocurrencies have a habit of breaking quiet market conditions with a sharp move either way, and traders should be aware of any potential breakouts.
Bitcoin (BTC) Daily Price Chart (May – November 19, 2019)
Traders may be interested in two of our trading guides – Traits of Successful Traders and Top Trading Lessons – while technical analysts are likely to be interested in our latest Elliott Wave Guide.
What is your view on Bitcoin (BTC) – bullish or bearish?? You can let us know via the form at the end of this piece or you can contact the author at nicholas.cawley@ig.com or via Twitter @nickcawley1.


