


UK General Election and GBP/USD Price, Charts and Analysis
- UK opinion polls show UK PM Boris Johnson increasing his lead.
- GBP/USD eyes multi-month high, EUR/GBP at six-month low.
Brand New Q4 2019 GBP and USD Forecasts and Top Trading Opportunities
UK Opinion Polls Show PM Johnson’s to Win General Election with Ease, Sterling Rallies.
Sterling has opened the week on a positive footing after weekend General Election polls showing UK PM Boris Johnson comfortably ahead of Labour’s Jeremy Corbyn. Four polls showed Boris Johnson winning a majority on December 12, with YouGov giving the Tories a 17 point lead, Opinium a 16 point lead, Deltapoll a 15 point lead, while SevantaComRes put the Conservatives eight points ahead. Bookmakers have also cut their odds on a Conservative majority to around 4/9, with no overall majority at 6/4 while a Labour majority is offered at 25/1. With nearly a month to go before the General Election, polls can, and will, move either way, the current lead for the Conservatives will have alarm bells ringing at Labour’s headquarters.
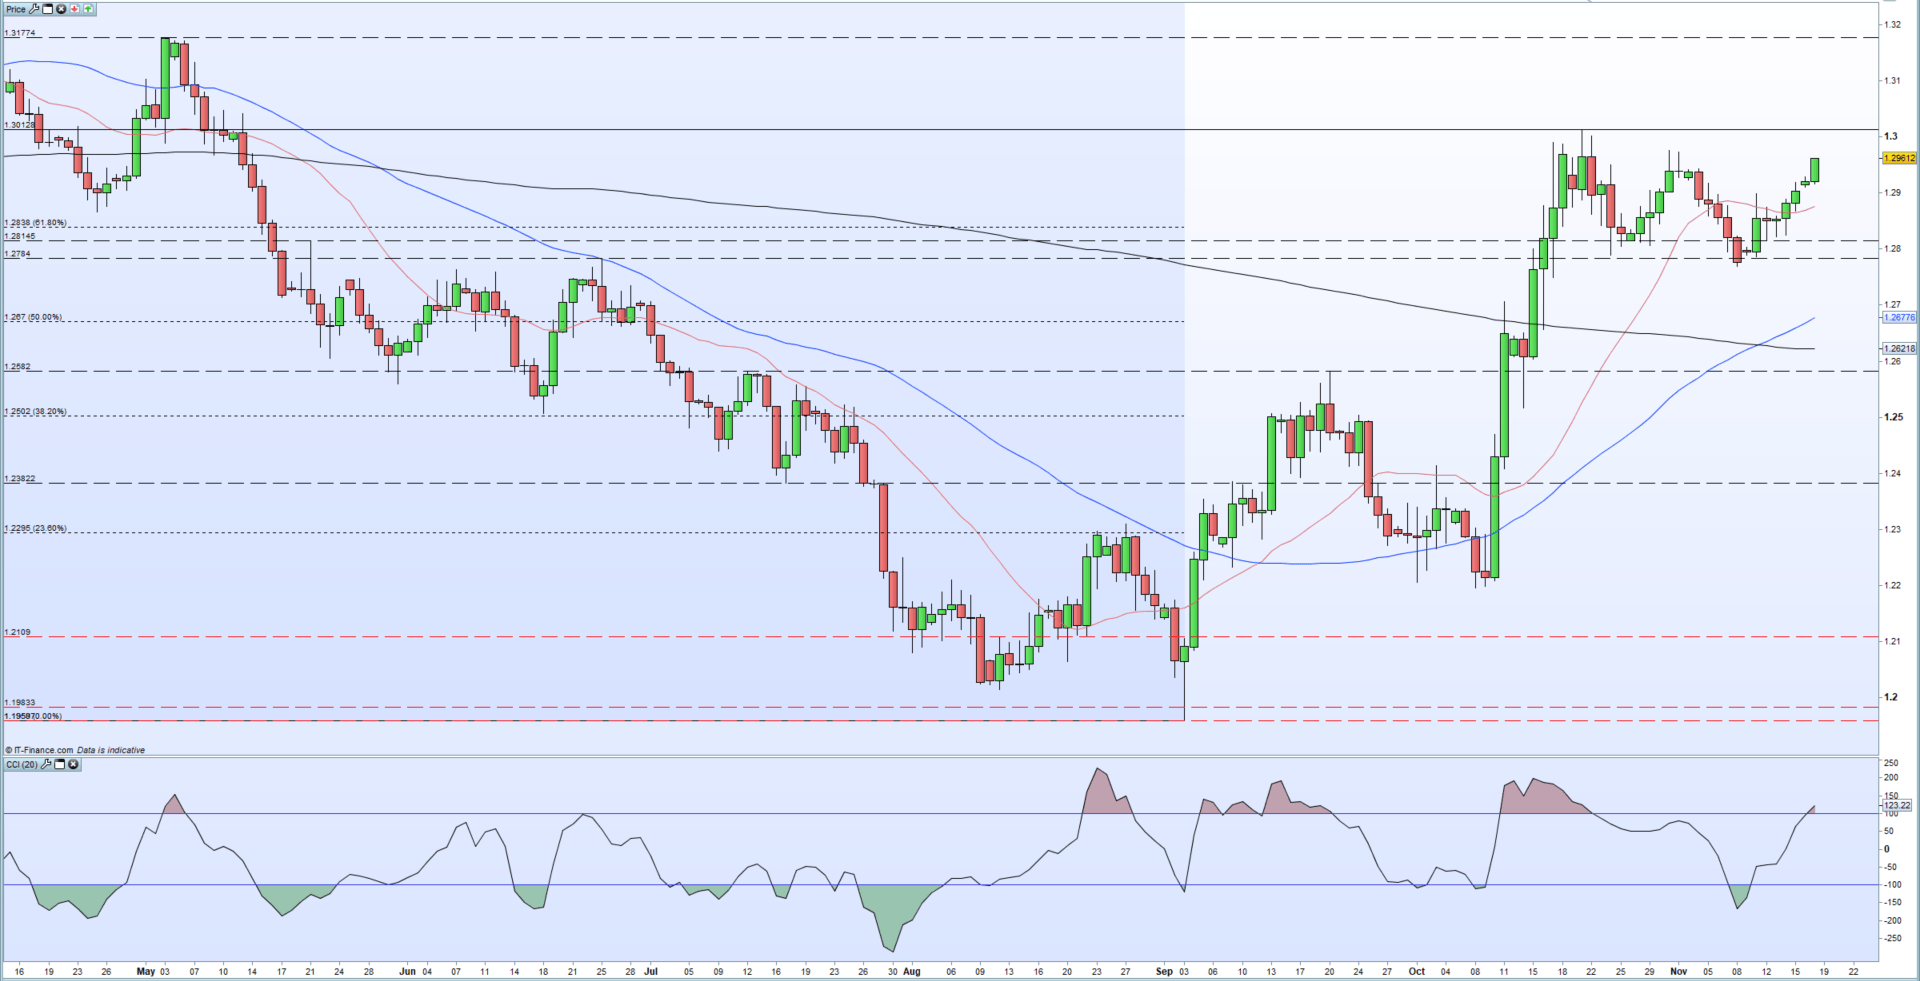
Sterling continues to price in the good news with GBPUSD nearing 1.3000 and looking to test highs last seen in early May. There are a handful of recent highs topping out at 1.3013 that need to be broken and closed above before the pair look at the May3 high at 1.3177. The pair also got a technical boost last Monday with the formation of a golden cross – when the 50-day ma moves higher through the 200-dma – a bullish chart set-up. GBP/USD has moved nearly two big figures higher since last Monday. The CCI indicator does warn that GBPUSD is becoming overbought.
IG Client Sentiment shows that retail traders are 52% net-long GBP/USD, a bearish contrarian bias. However, daily and weekly sentiment shifts give us a bullish outlook.
GBP/USD Daily Price Chart (April - November 18, 2019)
EUR/GBP at a Fresh Six-Month Low
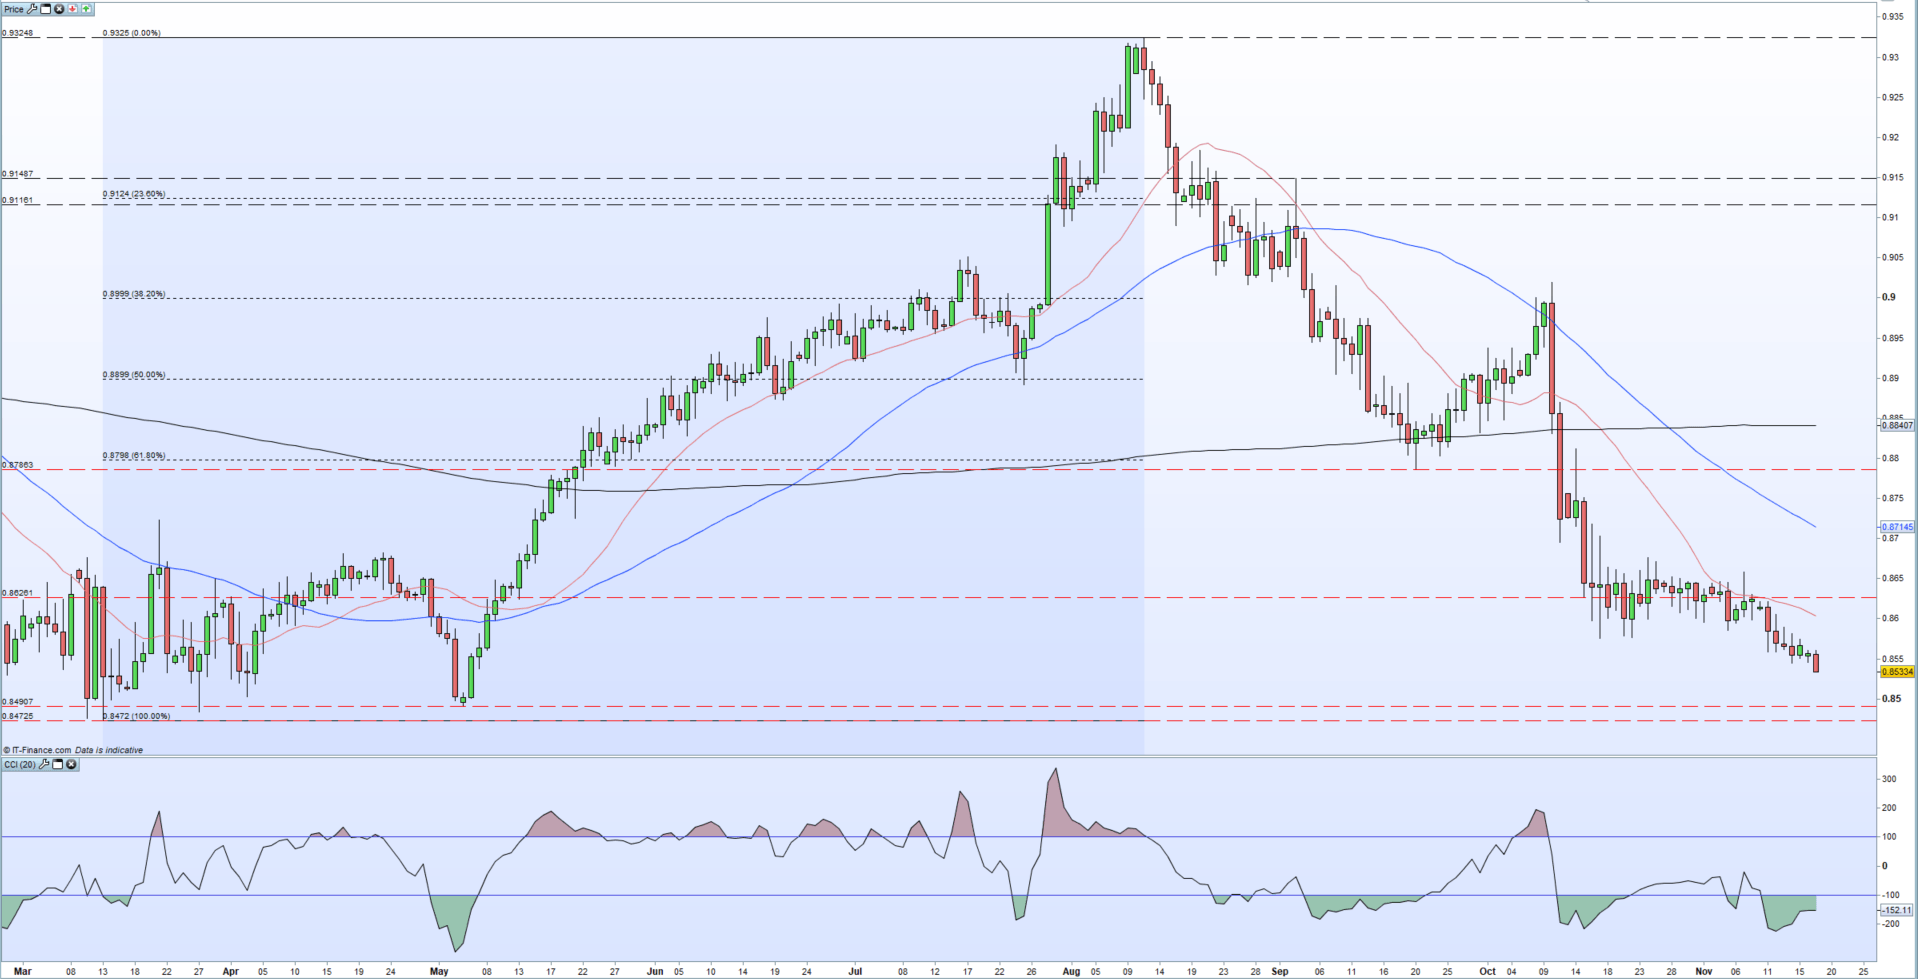
The currency pair most linked to Brexit, EUR/GBP, continues to set fresh multi-month lows and is closing in on a pair of notable lows. The pair currently trade at 0.8535 and near the May 5 low at 0.8490 which guards the March 13 low at 0.8473. A break and close lower opens the way to the low at 0.8313 made mid-April 2017.
EUR/GBP Daily Price Chart (March – November 18, 2019)
Traders may be interested in two of our trading guides – Traits of Successful Traders and Top Trading Lessons – while technical analysts are likely to be interested in our latest Elliott Wave Guide.
What is your view on Sterling (GBP) – bullish or bearish?? You can let us know via the form at the end of this piece or you can contact the author at nicholas.cawley@ig.com or via Twitter @nickcawley1.


