


US-CHINA TRADE WAR LATEST: PHASE ONE AGREEMENT UNLIKELY THIS MONTH
- The Chinese Yuan weakened above the 7.0 handle against the US Dollar while the price of gold spiked higher and equity indices slipped following reports that the phase one US-China trade agreement will be pushed back
- The latest trade war development adds to mounting signs that US-China trade tension is back on the rise
- Check out this Trade War Timeline for a history of trade wars and their impact on financial markets
Headlines just crossed the wires that the US-China phase one trade agreement originally expected to be signed mid-November could be delayed to December. President Trump has touted the trade deal reached last month almost daily since its original announcement and market expectations for thawing US-China trade tensions helped push US equity benchmarks to record high levels.
The latest report from Reuters citing an official spokesperson noted that a Trump-Xi signing this month grows increasingly difficult to find a location for the leaders to meet. This follows recent news that China is demanding last-minute concessions from the US to walk back additional tariffs in addition to harsh remarks from US VP Mike Pence.
GOLD PRICE CHART: 1-MINUTE TIME FRAME (NOVEMBER 06, 2019 INTRADAY)
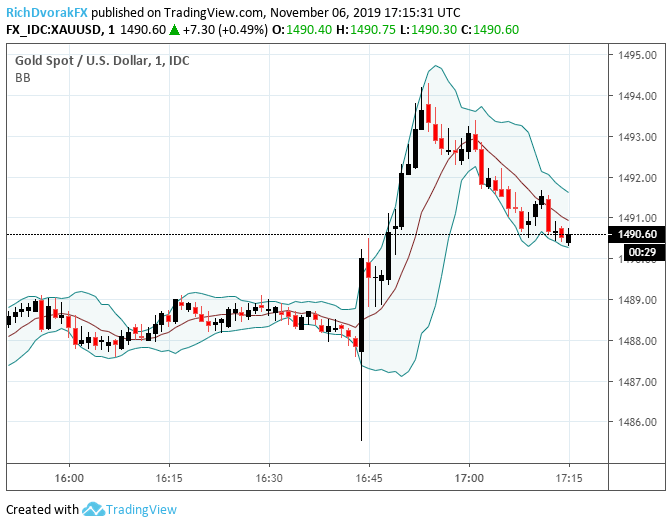
Risk appetite was damaged immediately following the report judging by the market reaction in spot gold prices which jumped from 1,488 toward the 1,495 level while the S&P 500 Index dropped roughly 0.35% from intraday highs.
S&P 500 INDEX PRICE CHART: 1-MINUTE TIME FRAME (NOVEMBER 06, 2019 INTRADAY)

Also, quite notable was spot USD/CNH price action surging back above the ‘taboo’ 7.000 handle in response to the latest US-China trade war development.
USD/CNH PRICE CHART: 1-MINUTE TIME FRAME (NOVEMBER 06, 2019 INTRADAY)

It has been previously mentioned that the direction of the Chinese Yuan can help gauge the US-China trade war and serve as a potential bellwether to the current state of US-China trade relations as well as broader market risk appetite.
-- Written by Rich Dvorak, Junior Analyst for DailyFX.com
Connect with @RichDvorakFX on Twitter for real-time market insight


