


Dow Jones, S&P 500 Forecasts:
- The Dow Jones finds itself trading near record levels despite a notable fundamental deterioration
- Alongside a shifting fundamental landscape, relatively sparse trading volume could be a cause for concern among equity investors
- Further still, November is historically one of the more volatile months on average, which could translate to a tumultuous end to the year for the Dow Jones and S&P 500
Dow Jones, S&P 500 Forecasts Are Undermined by Low Volume
The Dow Jones and S&P 500 pushed to fresh record highs this week as trade war optimism and a decidedly accommodative Federal Reserve worked to drive stocks higher. It was reported on Wednesday, however, that the US-China meeting on trade would be postponed – possibly until December – and that a meeting location has not yet been agreed upon. In turn, stocks fell under pressure as concern outpaced optimism. Nevertheless, the three major US indices remain near record levels, but Wednesday’s news could spark a larger event given the relatively sparse trading volume the Dow Jones and S&P 500 have experienced since mid-October.

Data source: Bloomberg
While lower volume is not inherently bad on its own, it can serve to illustrate a lack of conviction. Essentially, if a stock establishes a large gain on high volume, traders are more likely to see the move as a sign that something has fundamentally shifted in the outlook. On the other hand, a series of gains established alongside low volume – especially if volume continues to trail off as the stock climbs – can hint at an eventual reversal as buying fades and bulls wrestle to maintain control. Thus, October and November’s exceptionally low volume and volatility could leave the Dow Jones and S&P 500 vulnerable to a quick reversal if a fundamental shift materializes. With that said, Wednesday’s trade talk delay appears an insufficient catalyst to spark such a shift, but it could pave the way for another theme to deliver on the follow-through.
S&P 500 Price Chart: Daily Time Frame (October 2018 – November 2019) (Chart 1)
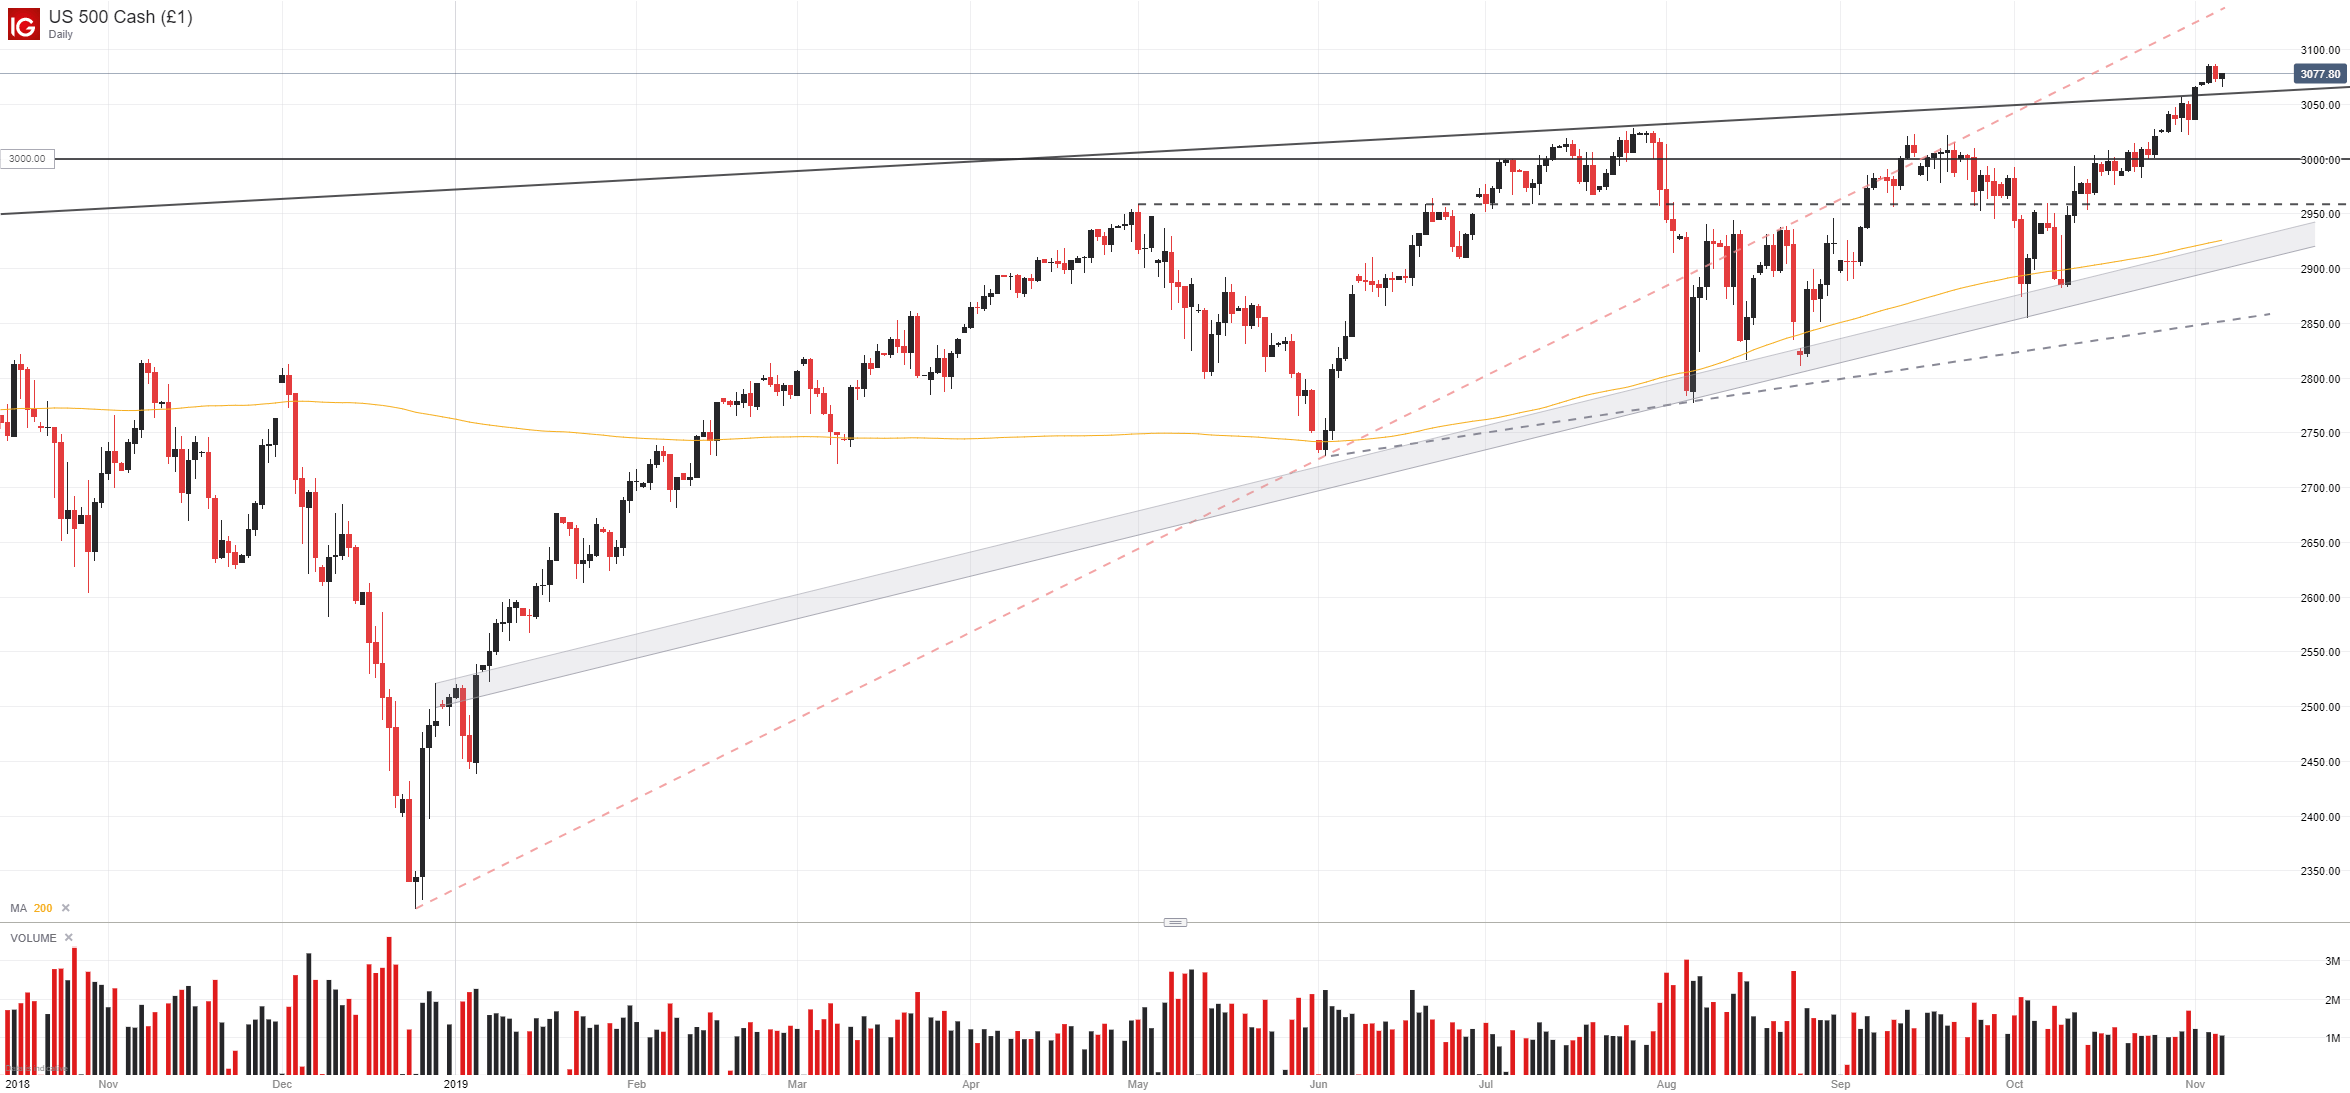
Therefore, it may be prudent to take stock of nearby support levels on both the S&P 500 and Dow Jones. For the S&P 500, initial support could look to reside at July’s highs around 3030. Subsequent buoyancy may be found at the psychologically significant 3000 mark before August’s range at 2945 comes into play.
Dow Jones Price Chart: Daily Time Frame (October 2018 – November 2019) (Chart 2)

Shifting our focus to the Dow Jones, the Industrial Average will look to employ prior all-time highs at 27400 as support moving forward. The horizontal zone of support aligns with the ascending trendline that roughly coincides with prior highs from October 2018 and this past September. Together, the area will mark an important lower-side barrier. A break beneath could see the Industrial Average test horizontal support around 26700.
With that in mind, traders should keep a watchful eye on the fundamental landscape. Earnings season has come and gone and trade war optimism – which has been partially responsible for present valuations – has been damaged, leaving the S&P 500 and Dow Jones grasping for the next bullish theme. If such a theme does not appear, stocks could look to edge lower and consolidate.
--Written by Peter Hanks, Junior Analyst for DailyFX.com
Contact and follow Peter on Twitter @PeterHanksFX
Read more: Stock Market Outlook Weakens After US-China Meeting Delayed


