


Gold Price Forecast, Technical Analysis and Charts:
- Gold remains above the recent uptrend line for now.
- Financial markets remain risk-on and that’s weighing on gold.
Brand New Q4 2019 Gold Forecast and Top Trading Opportunities
DailyFX Interactive Global Commodities Infographic
Gold Price Fundamental Outlook
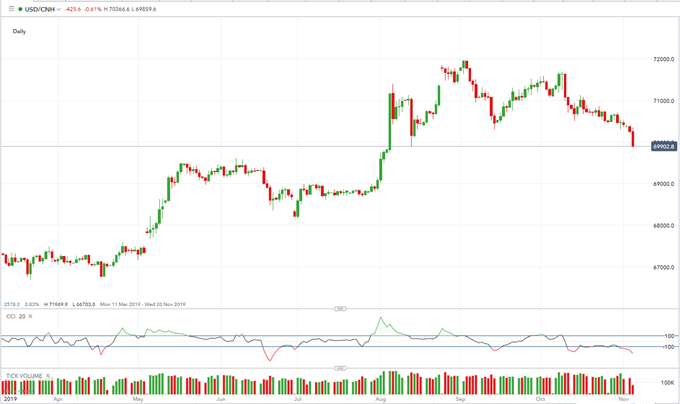
Gold’s recent push higher is fading as markets put their faith in the latest round of optimistic US-China trade deal reports. News outlets are saying that the US may dial back on some of the tariffs imposed on Chinese goods on September 1 to help push through phase one of a deal with China, and markets are taking a positive slant. The Chinese Yuan is trading back below 7.00 against the US dollar for the first time in three months, after having hit a peak of USD/CNH 7.196 in early September.
USD/CNH Daily Price Chart (March – November 5, 2019)
Gold Price Technical Analysis
While risk-on asset markets are booming – S&P 500, Nasdaq and the Dow Jones all hit record highs Monday –traditional risk-off markets – Japanese Yen, Swiss France and gold – are all fading lower. Gold’s recent move higher helped set-up a bullish pennant pattern, but this is now starting to break down. The extended uptrend line from the October 1 low remains in place and continues to provide support for a further move higher although his move is weakening. The trend line is around $1,500/oz. and is just above both the 20- and 50-day moving averages and a break and close below all three would call the recent bull move further into doubt. Initial support from the downtrend line around $1,488/oz. before the recent double lows at $1,482/oz. before $1,474/oz.
Gold Price Daily Chart (March – November 5, 2019)

How to Trade Gold: Top Gold Trading Strategies and Tips
IG Client Sentiment shows how traders are positioned in a wide range of assets and markets. Retail customers are 64% net-long gold, a bearish contrarian bias. However, recent daily and weekly positional shifts give us a mixed outlook.
Traders may be interested in two of our trading guides – Traits of Successful Traders and Top Trading Lessons – while technical analysts are likely to be interested in our latest Elliott Wave Guide.
What is your view on Gold – bullish or bearish?? You can let us know via the form at the end of this piece or you can contact the author at nicholas.cawley@ig.com or via Twitter @nickcawley1.


