


S&P 500 Technical Analysis:
- The S&P 500 is just 27 points beneath record highs, but has been unable to distance itself from the 3000 level
- Still, the Index enjoys a collection of support slightly beneath the current trading price
- A strong earnings performance across the board could see stocks break higher
S&P 500 Technical Analysis as Earnings Season Hits its Stride
Earnings season is in full swing with reports from some of the country’s largest corporations crossing the wires and offering their influence on the S&P 500. That said, volatility across the entire index is surprisingly low, with the VIX trading at just 14. On a single stock basis, however, implied volatilities are expectedly surging. In turn, the index lacks momentum in either direction, which has made surmounting resistance particularly challenging.
S&P 500 Price Chart: 4 – Hour Time Frame (May – October) (Chart 1)
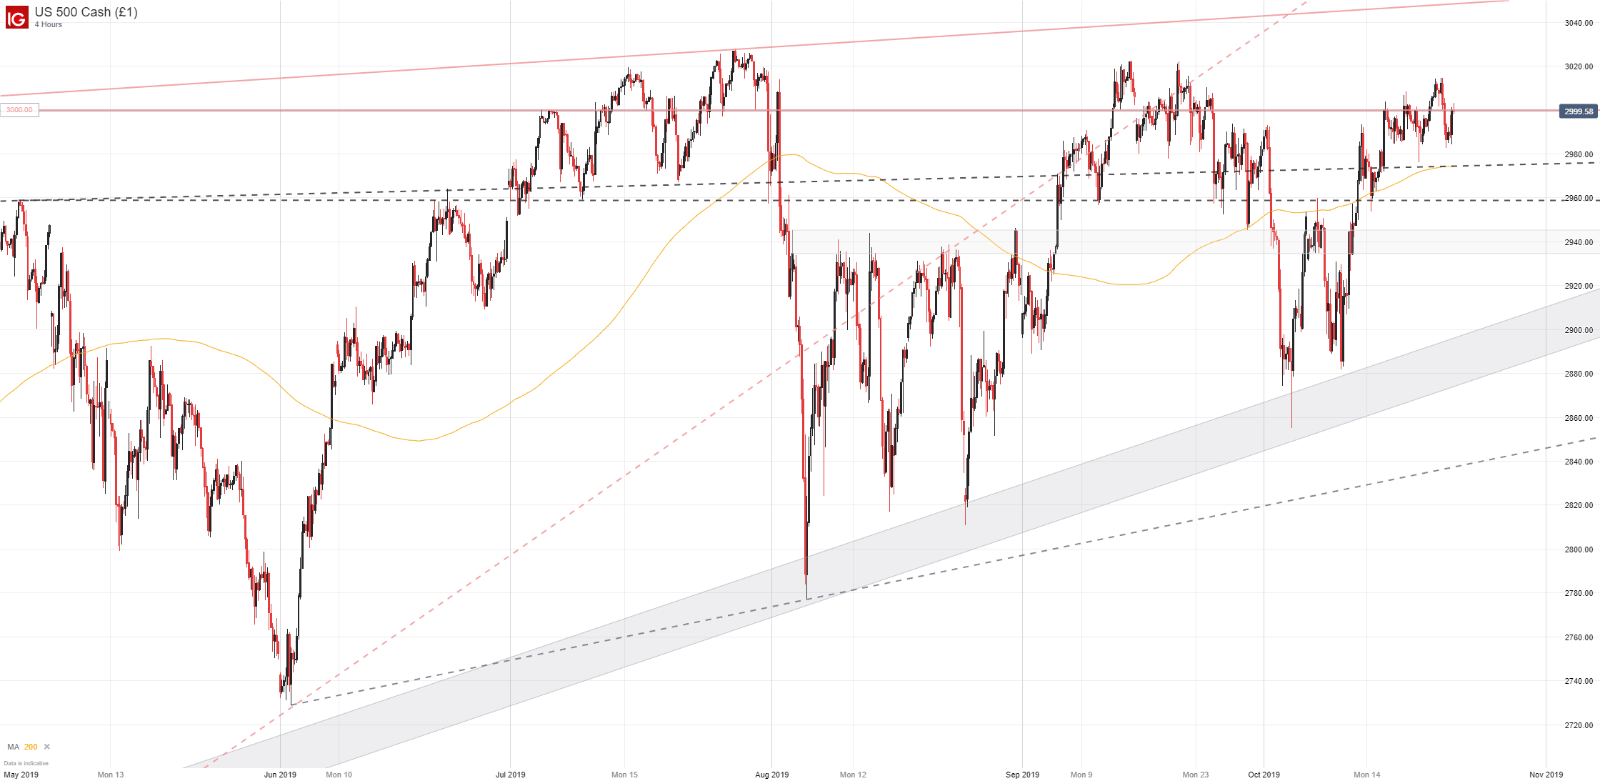
To that end, the 3000 mark has proved troublesome. Since October 15, the index has fluctuated above and below, but a comfortable close in either direction has not materialized. Consequently, 3000 will continue to play an important role as earnings season progresses. Although the initial reaction may be to highlight the index’s inability to break higher, price action from June is largely constructive. A series of higher lows speaks to continued bullish interest and that interest has helped to push the S&P 500 to where it is today.
For a deeper analysis of the S&P 500 using IGCS data, sign up for my weekly IGCS walkthrough webinar.
Further, past price action has established a series of support levels that the index will look to employ. Starting at the nearby 200-period moving average on the 4-hour chart and coinciding with an ascending trendline from prior highs, 2975 will look to offer buoyancy. Secondarily, the index’s swing high in May – at 2960 – may look to bolster price before the upper bound of the August range is threatened around the 2945 level. A break here would open the door to further losses, likely drawing in the ascending channel from previous lows around 2900.
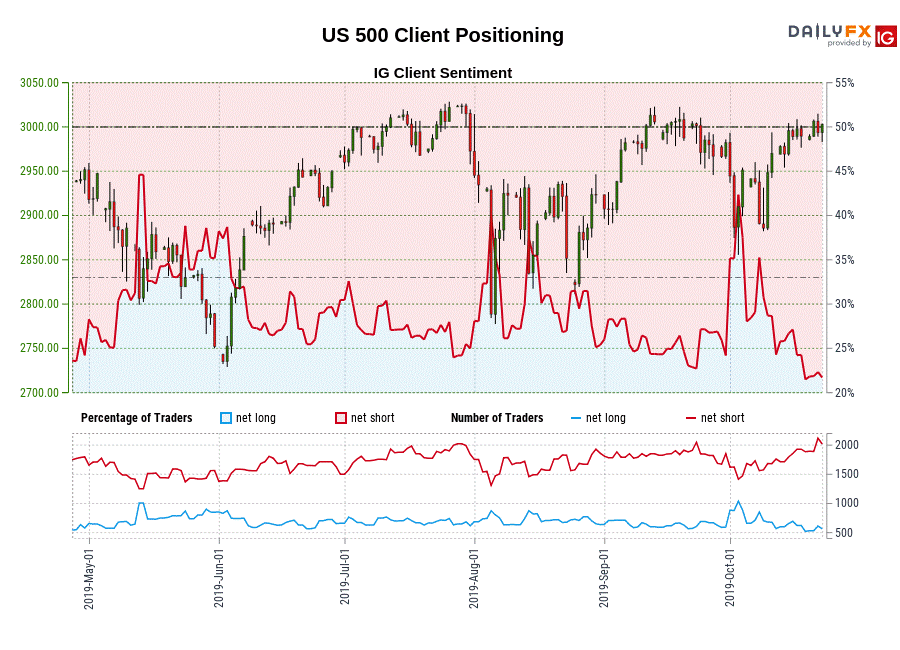
Regardless, bulls seem to remain in the driver’s seat at the time being as evidenced by buying interest despite poor set of earnings on Wednesday morning. Further still, IG Client Sentiment Data offers an encouraging sign for bulls. Since we typically take a contrarian stance to IGCS, the fact that retail trader data shows 23.75% of traders are net-long, it may suggest the S&P 500 is due to continue higher.Therefore, bullish sentiment data, a plethora of technical support and low volatility will look to work in unison to push the S&P 500 to new highs around 3027.
--Written by Peter Hanks, Junior Analyst for DailyFX.com
Contact and follow Peter on Twitter @PeterHanksFX
Read more: Can Earnings Propel the Dow Jones and Nasdaq 100 to New Heights?


