


EUR/USD Price, Chart and Outlook:
- Fundamental backdrop for the Euro remains unchanged.
- EUR/USD finding support from the 50-day moving average.
Brand New Q4 2019 USD and EUR Forecast and Top Trading Opportunities
EUR/USD Treading Water for Now
A lack of any positive drivers has left EUR/USD lethargic this week with traders looking at other currency pairs for trading opportunities. The pair have moved slightly higher due to the current weakness in the US dollar, but the drift higher has been tempered by the lack of any positive economic news or data out of the Eurozone. Eurozone industrial production y/y fell further in August – to -2.8% from -2.0% in July – while Eurozone ZEW sentiment surveys for October remained heavily in negative territory and below September’s levels. There is little Eurozone hard data for the rest of the week. The single-currency may benefit if a Brexit deal is finally agreed, yet all the positive talk surrounding the negotiations has so far failed to bring a deal that both sides are willing to, and can, sign off.
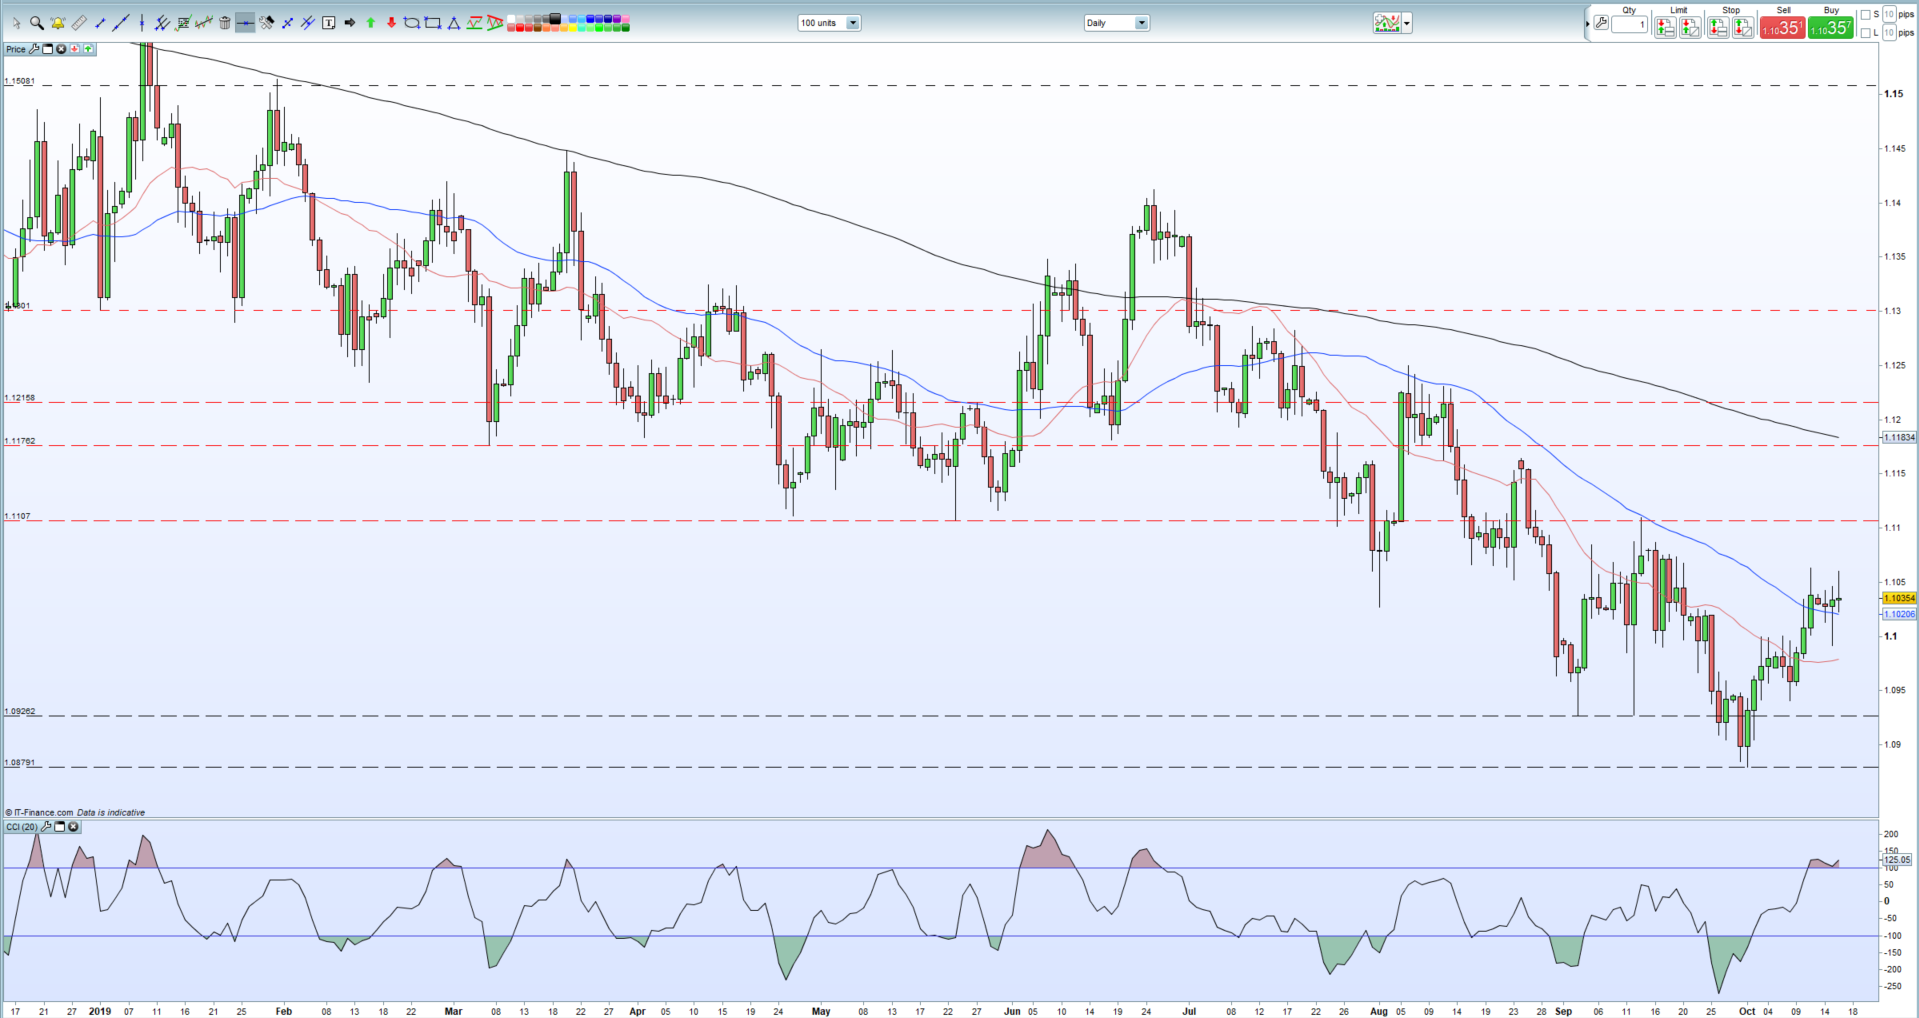
The daily chart shows EUR/USD currently finding short-term support from the 50-day moving average for the first time in three months, although the pattern of lower highs and lower lows off the June 25 high remains in place. The pair are also flashing an overbought signal using the CCI momentum oscillator.
To move decisively higher, EUR/USD needs to break and close above the October 11 three-week high at 1.1063 and the September 13 multi-week high at 1.1112. Any sell-off would the 50-day ma at 1.1018 tested ahead of the 20-dma at 1.0980. A break and close below would open the way for a re-test of the recent double-low around 1.0940.
EURUSD Daily Price Chart (December 2018 – October 16, 2019)
IG Client Sentiment shows that traders are 51% net-short EURUSD, a bullish contrarian bias.
However recent daily and weekly positional changes give us a mixed outlook for EUR/USD.
Traders may be interested in two of our trading guides – Traits of Successful Traders and Top Trading Lessons – while technical analysts are likely to be interested in our latest Elliott Wave Guide.
What is your view on the Euro and the US Dollar – bullish or bearish?? You can let us know via the form at the end of this piece or you can contact the author at nicholas.cawley@ig.com or via Twitter @nickcawley1.


