


Dow Jones & Nasdaq 100 Forecast:
- Earnings season is off to a strong start with various stocks in the financial sector beating out expectations
- Coupled with trade war optimism, the fundamental landscape has aligned to propel the Dow Jones and Nasdaq indices near record highs
- Still, Netflix’s earnings report due later Wednesday could hamstring the FAANG group and tech sentiment alike if quarterly findings disappoint
Can Earnings Propel the Dow Jones and Nasdaq 100 to New Heights?
After a third session of upbeat earnings, the Dow Jones and Nasdaq remain narrowly beneath record levels. Coupled with the potential partial trade war deal – dubbed “phase one” – in the works, fundamentals have laid the groundwork for the two Indices to make a run at all-time highs. Therefore, barring an unexpected bearish development, the path of least resistance seems to be cautiously higher.
Dow Jones Technical Forecast
Looking to the Dow Jones specifically, the Industrial Average has very little resistance before a new all-time high can be posted. That said, the ascending trendline from prior highs in January and October 2018 stalled September’s attempt higher and could look to play a similar role in October. If the DJIA is able to surmount the level, it would expose the record level at 27,400.
Dow Jones Price Chart: 4 - Hour Time Frame (May 2019 – October 2019) (Chart 1)
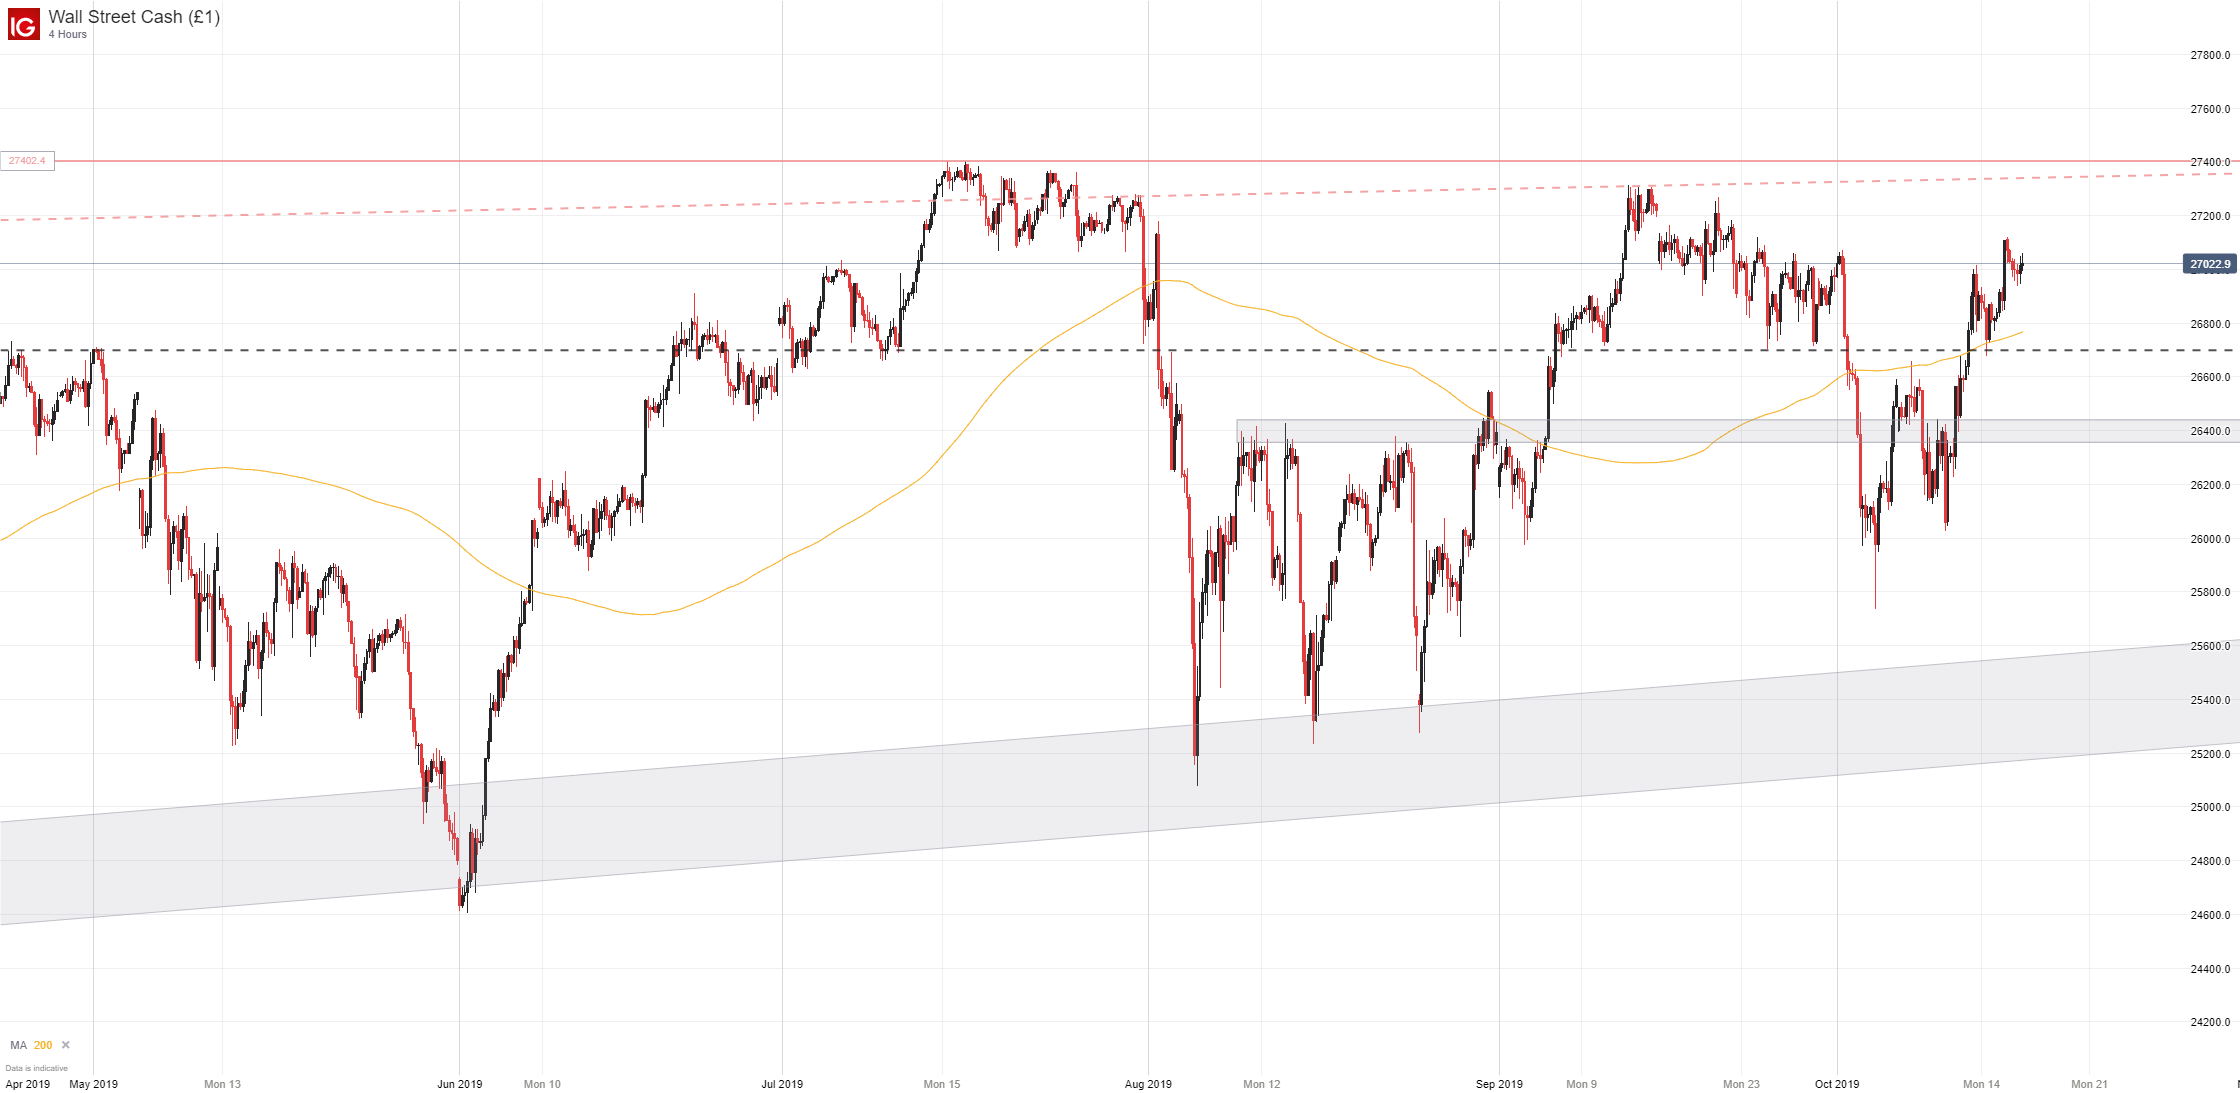
On the other hand, the Industrial Average enjoys a collection of technical support nearby. Coinciding with horizontal support around 26,700, the 200-period moving average on the 4-hour chart will look to stall an initial move lower – an event that could arise if Netflix earnings disappoint and adversely impact tech sentiment. Subsequent support will come into play around the upper bound of the Index’s August range around 26,400.
Nasdaq 100 Technical Forecast
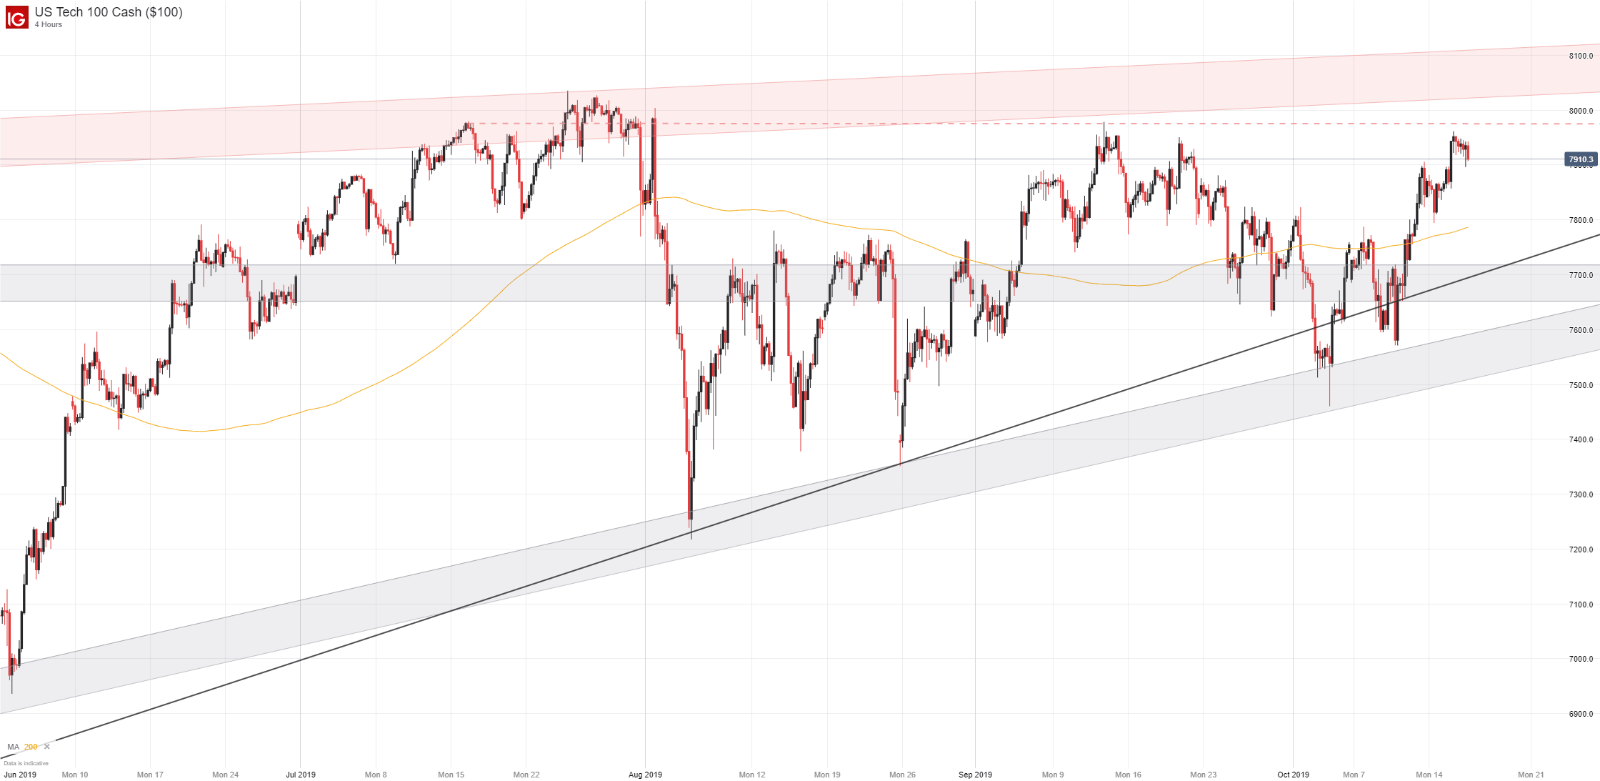
Turning to the tech-heavy Nasdaq, resistance is similarly sparse. A horizontal trendline to the topside will look to stall an initial break higher, residing around the 7975 mark, before NDX can look to post new all-time highs. Conversely, the Index enjoys an abundance of support around the 7800 and 7700 levels. If both areas are broken, subsequent support will look to materialize around the 7450 level – the swing low from early October.
Nasdaq 100 Price Chart: 4 - Hour Time Frame (July 2018 – October 2019) (Chart 2)
Despite the seemingly rosy landscape for both indices, investors should still exercise caution. With the VIX index slipping beneath 14, it could be argued complacency has seeped into the market. History has shown time and time again the US-China trade war is a complex issue that has caused trade talks to breakdown and end without an agreement. Therefore, traders should keep an eye on trade war developments that could look to derail optimism and undercut the case for new heights even as they look poised to capture them.
--Written by Peter Hanks, Junior Analyst for DailyFX.com
Contact and follow Peter on Twitter @PeterHanksFX
Read more: Stock Market Q4 Forecast: The Weight of Trade Wars May Finally Crack the Dow Jones


