


GBP/USD Price, Charts and Analysis
- Sterling drives higher as EU offers fresh hope for a negotiated Brexit.
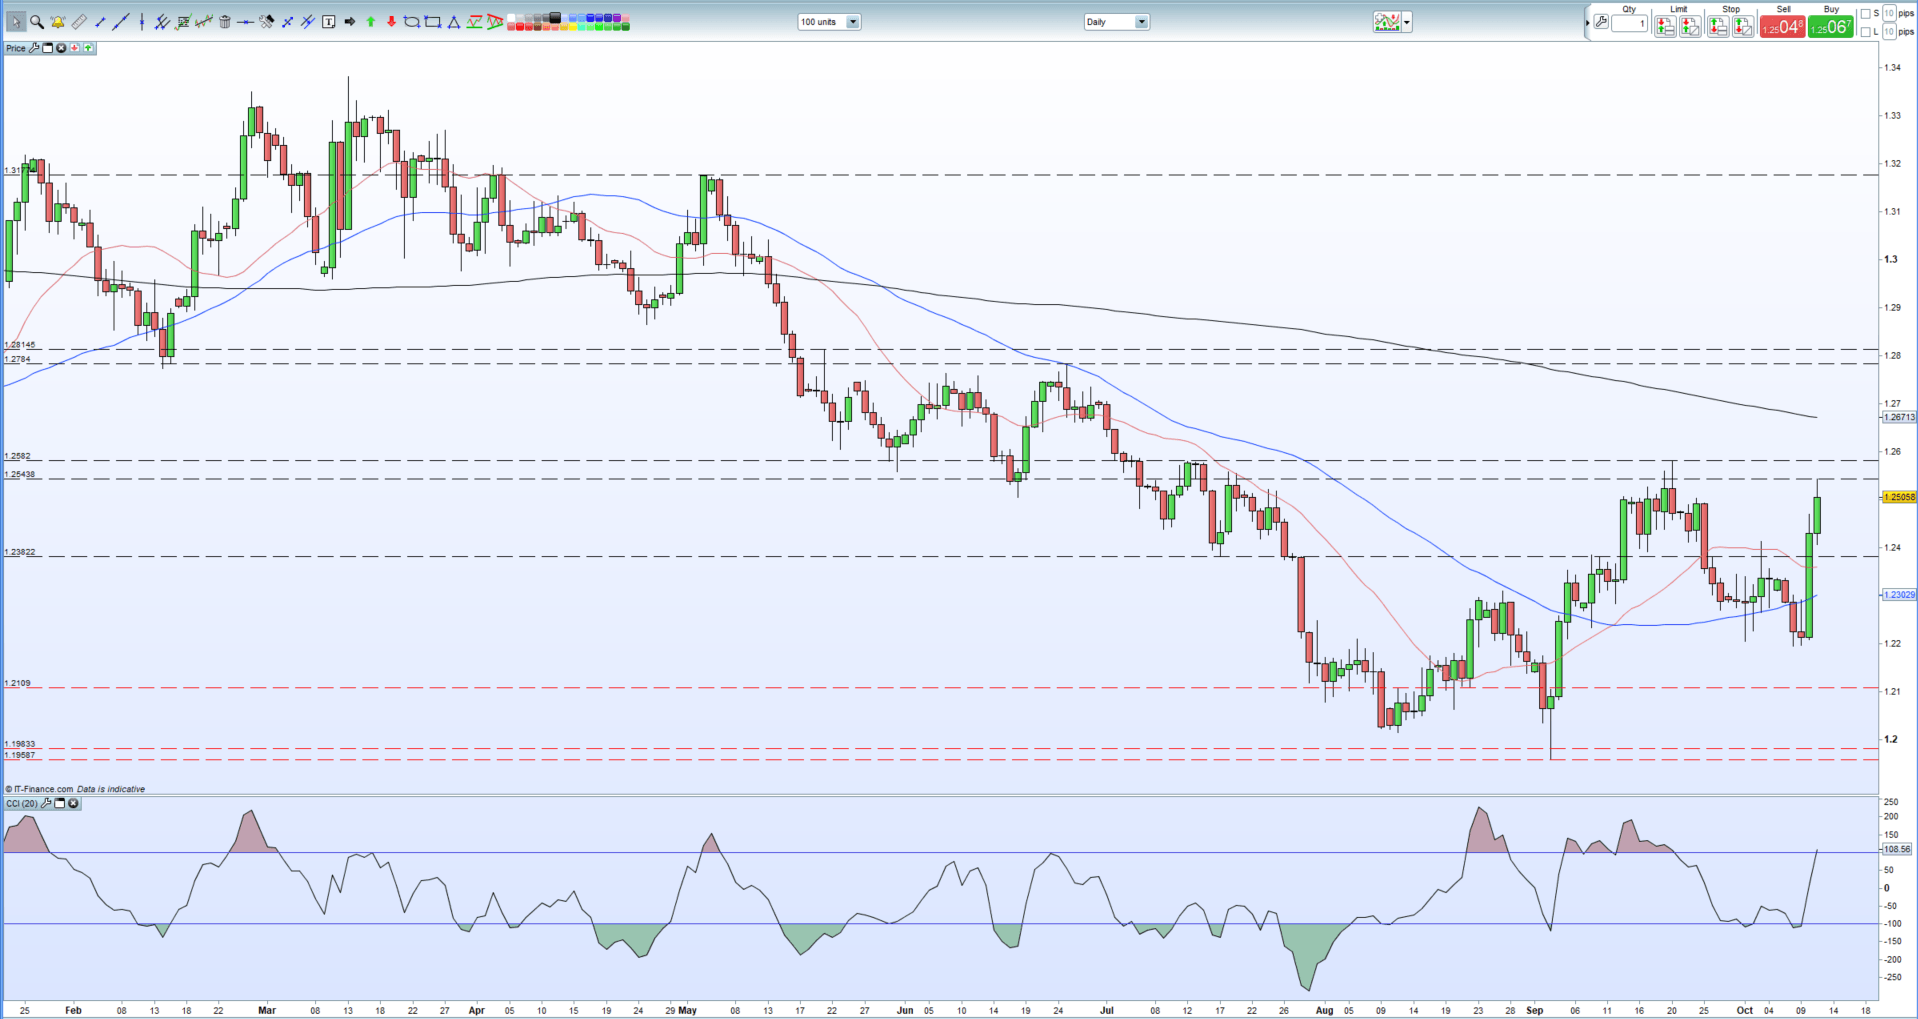
- GBP/USD pushes through 1.2500 and nears a three-month high.
Brand New Q4 2019 GBP and USD Forecasts and Top Trading Opportunities
GBP/USD is nearing a fresh three-month high after the latest commentary from EC President Donald Tusk added further hope that a Brexit deal can be struck between the EU and UK, as the October 31 deadline nears. Speaking earlier today, Tusk said that while ‘we are still in a situation in which the UK has not come forward with a workable, realistic approach’ he had received ‘promising signals’ from Irish PM Leo Varadkar that a deal ‘is still possible’. In addition, Tusk said that while there is no guarantee of success and time is practically up, ‘even the slightest chance must be used’. This may be seen as blame deflection by the EU, it is also the first time in months and years of wrangling that both sides are making positive noises about a deal.
Sterling traders have taken this news, and as further proof of positive intent from both sides and the British Pound continues to build on Thursday’s rally after Irish PM Varadkar and UK PM Johnson said that see ‘a pathway’ to a Brexit deal. After trading as low as 1.2207 on Thursday, GBP/USD touched a high of 1.2544 today before drifting slightly lower. A break above the September 20 high at 1.2582 would see the pair back at levels last seen in mid-July. A break and close above here would also confirms Sterling’s turnaround and would set the pair up for an attempt at the 200-day moving average, currently at 1.2671 ahead of the June 25 lower high at 1.2784.
GBP/USD Daily Price Chart (January - October 11, 2019)
Traders may be interested in two of our trading guides – Traits of Successful Traders and Top Trading Lessons – while technical analysts are likely to be interested in our latest Elliott Wave Guide.
What is your view on Sterling and Brexit – bullish or bearish?? You can let us know via the form at the end of this piece or you can contact the author at nicholas.cawley@ig.com or via Twitter @nickcawley1.


