


EUR/GBP Price, Charts and Analysis
- Fibonacci retracement an obstacle for EUR/GBP.
- UK PM and Irish Taoiseach Brexit meeting later today.
Brand New Q4 2019 GBP Forecasts and Top Trading Opportunities
Brexit developments and the latest look at monthly UK GDP (08:30 GMT) will be the main fundamental drivers of Sterling price action Thursday, while the Euro is expected to become slightly more volatile when the latest ECB minutes are released at 11:30 GMT. Brexit negotiations continue with UK PM Boris Johnson meeting with Irish Taoiseach Leo Varadkar around mid-day to continue discussions on the vexed issue of the Irish backstop.
EUR/GBP traders should watch these fundamental drivers carefully, especially as the pair approach the next level of technical resistance.
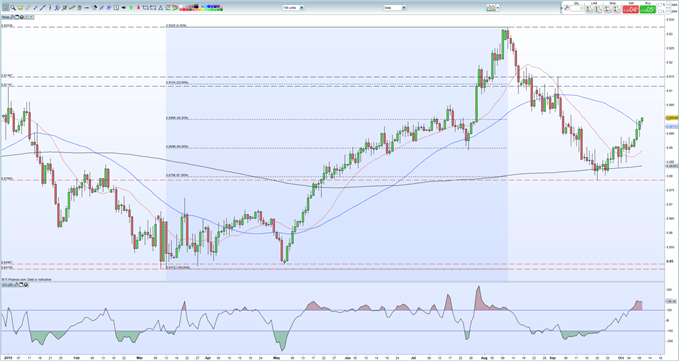
The daily chart shows the recent EUR/GBP rally stalling in early trade. The pair are currently testing resistance provided by the 38.2% Fibonacci retracement level from the March 13 – August 12 rally at 0.8999. A clean break and close above here opens the way higher with the top of an old bearish spinning top candlestick (July 17) around 0.9050 minor resistance ahead of a cluster of old highs and lows between 0.9100 and 0.9150.
Trading with a Spinning Top Candlestick
Failure to break higher leaves 0.8975 (50-dma and recent double-top) vulnerable ahead of 50% Fibonacci retracement at 0.8899 and the July 25 spike low/20-dma zone around 0.8890. The CCI indicator shows that EUR/GBP remains overbought, signaling caution, while the IG Client Sentiment Indicator shows that retail traders are 35% net-long the pair, a bullish contrarian indicator.
EURGBP Price Daily Chart (January – October 10, 2019)
Traders may be interested in two of our trading guides – Traits of Successful Traders and Top Trading Lessons – while technical analysts are likely to be interested in our latest Elliott Wave Guide.
What is your view on Sterling (GBP) – bullish or bearish?? You can let us know via the form at the end of this piece or you can contact the author at nicholas.cawley@ig.com or via Twitter @nickcawley1.


