Gold (XAU) Price Forecast, Chart and Analysis
- Gold finding support ahead of US - China trade talks.
- Downtrend in place with lower highs and lower lows.
Q4 2019 Gold Forecast and Top Trading Opportunities
US-China Trade Talks the Next Risk Event - Will Gold Benefit?
Risk markets are marginally positive in early turnover ahead of this week’s US-China trade talks in Washington. The 15-month battle has started to inflict economic damage on a global scale and any breakthrough would be welcome, although the latest move by US President Trump may have stymied any progress before it happens. The US yesterday added 28 Chinese organizations to its blacklist – blocking these companies from buying US goods - over concerns that China is violating the human rights of Muslim minorities in Xinjiang. While Trump may be publicly saying that the US and China will do a big deal, it is likely that his latest move will just add fuel to the long-running trade war saga.
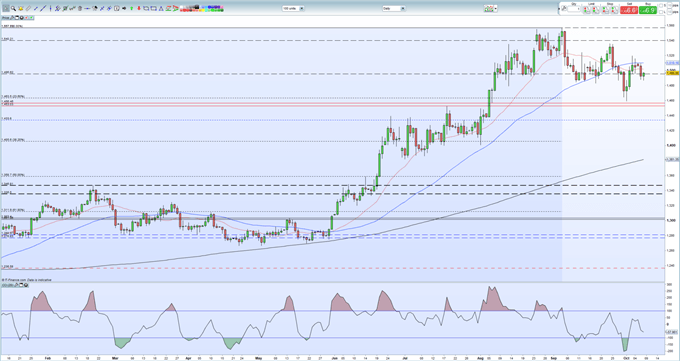
The daily gold chart continues to show a negative set-up with a recent series of lower highs and lower lows highlighting bearish momentum. The spot gold price is now also below the 20- and 50-day moving average yet is propped up by the 200-day ma much lower down. Recent price action around $1,490 - $1,495/oz. is being tested with a supportive band between $1,482/oz. and $1,485/oz. before 23.6% Fibonacci retracement comes into play at $1,463.5/oz.
To the upside a strong break back above $1,495/oz. should see momentum building towards $1,520/oz. with moving average resistance seen at $1,502/oz. and $1,510/oz. A close above $1,520/oz. will break the series of lower highs and add some bullish impetus into the space.
Gold Price Daily Chart (January – October 8, 2019)

IG Client Sentiment data show that 66.0% of retail traders are net-long of gold, a bearish contrarian indicator. See how daily and weekly shifts in positioning change trader sentiment.
How to Trade Gold: Top Gold Trading Strategies and Tips
Traders may be interested in two of our trading guides – Traits of Successful Traders and Top Trading Lessons – while technical analysts are likely to be interested in our latest Elliott Wave Guide.
What is your view on Gold – bullish or bearish?? You can let us know via the form at the end of this piece or you can contact the author at nicholas.cawley@ig.com or via Twitter @nickcawley1.


