Gold (XAU) Price and US Dollar Price (DXY)
- Gold has lost nearly 5% in the last week, taking out support levels.
- The US dollar basket is at a 28-month high
Q3 2019 Gold Forecast and Top Trading Opportunities
Gold Looks Oversold but the US Dollar Holds the Key
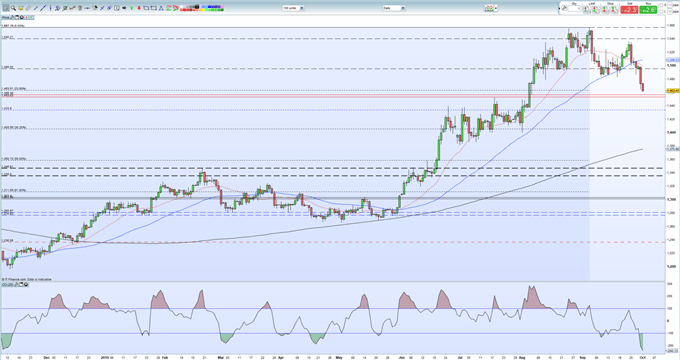
Gold has given back around $70/oz. over the last 6 trading sessions, driven lower by continued strength in the US dollar. While markets have turned mildly risk on, there still is enough background political and economic fear to give gold a bid. The main driver lower is the greenback with expectations of another interest rate cut this year being pared back, despite ongoing pressure from President Trump on the Fed to lower borrowing costs further.
On the daily gold chart, the 23.6% Fibonacci retracement level is just above a small gap on the August 5 bull candle between the July 18 high at $1,453/oz. and the August low at $1,456.5/oz. which may also provide support. Below here a cluster of old highs around the $1,433/oz. come into play. The CCI indicator is heavily oversold and is back at levels last seen in mid-August 2018. This coincides with the recent market low around $1,160/oz. and the start of the 13-month bull move to a high of $1,557/oz. A rebound will find initial resistance between $1,484/oz. and $1,495/oz.
Gold Price Daily Chart (November 2018 – October 1, 2019)

IG Client Sentiment data show that 68.0% of retail traders are net-long of gold, a bearish contrarian indicator. See how daily and weekly shifts in positioning change trader sentiment.
US Dollar Keeps Running Higher
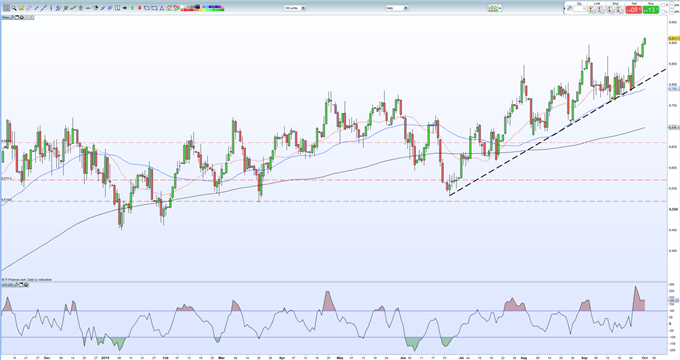
The US dollar continues to find a bid as expectations of a further rate cut diminish. Recent thoughts of an additional two interest rate cuts have been pared back with just one more 0.25% rate cut now expected in 2019. The daily US dollar basket chart remains bullish with the price now at a 28-month peak and looking to move higher. The CCI indicator does show that the USD basket is overbought, but the recent pattern of higher lows and higher highs suggest continued strength. The DXY is also above all three moving averages, another bullish impulse.
There is a raft of Fed speakers throughout this week who need to be listened to, ahead of the monthly US Labor Report on Friday at 12.30 GMT.
Live Data Coverage: US Non-Farm Payrolls - Webinar – Friday 12.15 GMT
US Dollar Basket Daily Price Chart (December 2018 – October 1, 2019)

How to Trade Gold: Top Gold Trading Strategies and Tips
Traders may be interested in two of our trading guides – Traits of Successful Traders and Top Trading Lessons – while technical analysts are likely to be interested in our latest Elliott Wave Guide.
What is your view on Gold – bullish or bearish?? You can let us know via the form at the end of this piece or you can contact the author at nicholas.cawley@ig.com or via Twitter @nickcawley1.


