


Bitcoin (BTC) News, Price, Chart and Analysis:
- Bitcoin slumps 15%, alt-coins lose more.
- Descending wedge pattern warned of breakout.
A Guide to Day Trading Bitcoin and Other Cryptocurrencies
Bitcoin (BTC) Price Slumps as Technical Levels Fold
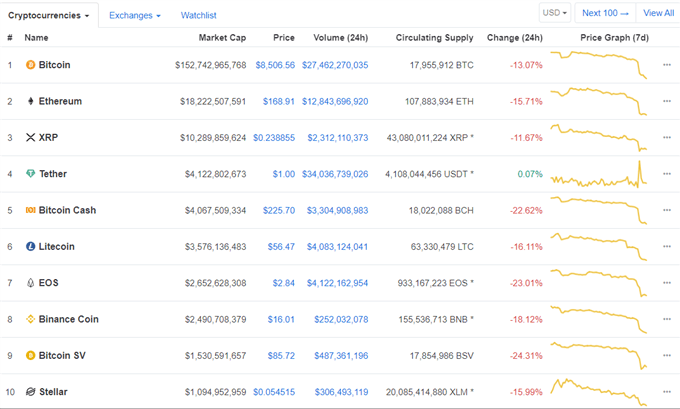
After a few weeks of thin trading ranges and low volumes, the cryptocurrency market burst into life Tuesday as the market sold-off sharply, with double-digit losses seen across the market. At one stage, the cryptocurrency market lost nearly $39 billion in market capitalization as sellers tried to find bids.
Bitcoin Price Outlook – Preparing a Move or Death by a Thousand Cuts?
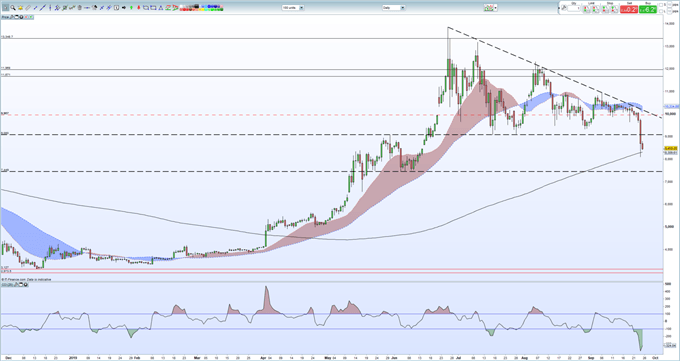
There is no one clear reason for the sell-off, but the daily chart has been warning of a move for the last 2-3 weeks as a descending wedge (triangle) pattern took shape. The moment the horizontal support line at $9,080 was broken, the sell-off accelerated all the way down around $8,000 before a small pullback.
Looking ahead, current support is based off the 200-day moving average around $8,300, before a cluster of early-mid June lows near $7,500 come into play. The worry for holders of Bitcoin is that a full measured move of the descending wedge could see BTC hit as low as early-mid $4000s – ($13,840 - $9,080 = $4,720. Then $9,080 - $4,720 = $4,365).
Bitcoin needs to break back above the descending slope, currently around $10.200 to regain any bullish momentum. The CCI indicator does suggest that BTC is heavily oversold and this may stem further losses in the short-term.
Bitcoin Daily Price Chart (December 2018 – September 25, 2019)
IG Client Sentiment data show that 83% of retail traders are net-long Bitcoin (BTC), a bearish contrarian indicator.
Traders may be interested in two of our trading guides – Traits of Successful Traders and Top Trading Lessons – while technical analysts are likely to be interested in our latest Elliott Wave Guide.
What is your view on Bitcoin – bullish or bearish?? You can let us know via the form at the end of this piece or you can contact the author at nicholas.cawley@ig.com or via Twitter @nickcawley1.


