


Gold Price Analysis, Charts and Prices
- Gold gives back all the last five weeks gains.
- Daily chart flashes an oversold warning, sentiment remains bearish.
Q3 2019 Forecasts and Top Trading Opportunities
The recent sell-off in gold has come to a temporary halt below $1,500/oz. as risk appetite picks up. The latest market talk concerning the ongoing US-China trade dispute is suggests a cooling of hostilities between the two sides ahead of high-levels trade talks next month. A story in the South China Morning Post, citing an anonymous source, said that China is looking to buy more US agricultural products as a trade deal sweetener. The report also said that China has offered to buy American products in exchange for a delay in a series of US tariffs and an easing of the Huawei supply ban. In June 2018, the US said that it would impose tariffs on $50 billion of Chinese goods, deteriorating relations between the two global super powers.
Gold has moved lower this week as markets look to price in this potentially, good news. Gold retains its status as one of the top safe-haven assets, alongside the Japanese Yen and the Swiss Franc, and any easing of trade tensions will see markets turn risk-on.
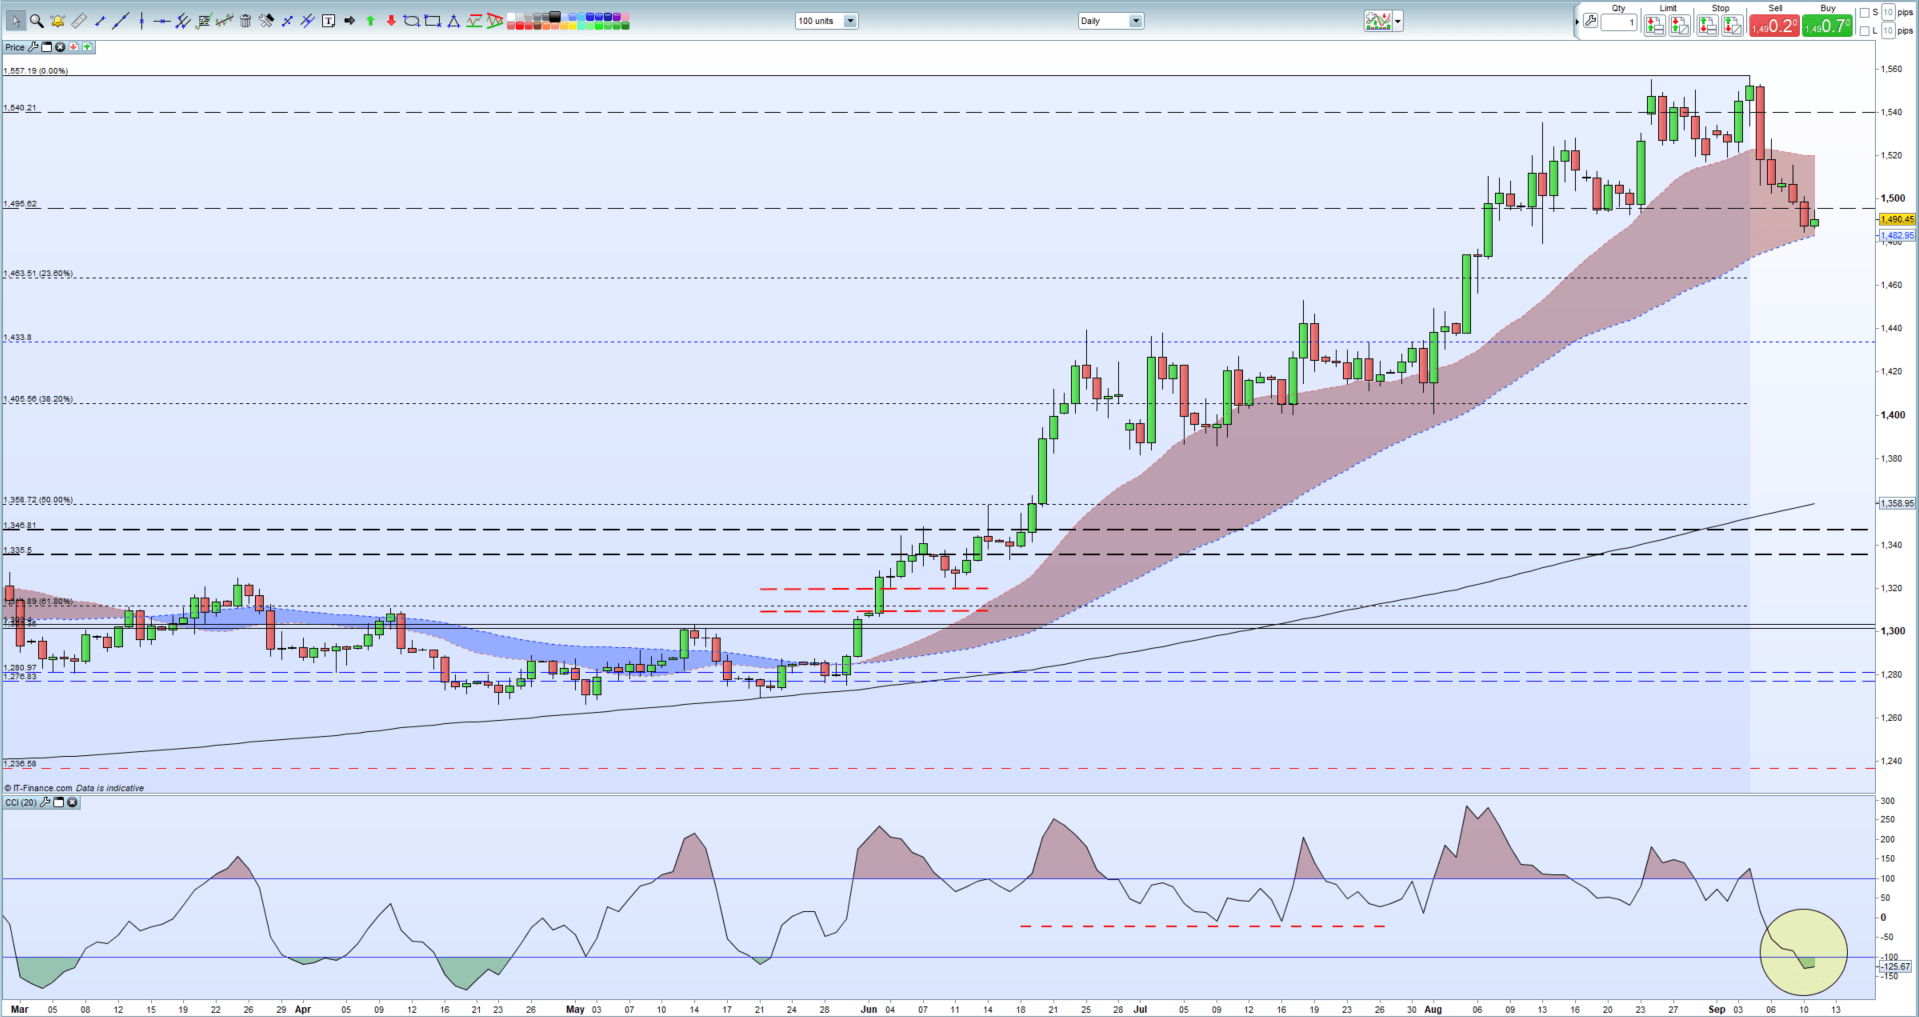
A look at the daily gold chart shows that gold fell to just above $1,484/oz. yesterday, a one-month low. The next level of support is a cluster between $1,472/oz. and $1,479/oz. and this zone needs to be watched closely in the event of any further sell-off. Below here, the 23.6% Fibonacci retracement level at $1,463.5/oz.
The daily chart is flashing an oversold warning with the CCI indicator deep into negative territory and near a five-month low. However the The IG Client Sentiment Indicator shows that retail traders are 70.0% net-long of Gold, a bearish contrarian bias and recent daily and weekly changes give us a stronger spot Gold bearish trading bias.
How to Trade Gold: Top Gold Trading Strategies and Tips
Gold Price Daily Chart (March – September 11, 2019)
The IG Client Sentiment Indicator shows retail traders are 70.0% net-long of Gold, a bearish contrarian bias. However daily and weekly changes give us a stronger spot Gold bearish trading bias.
Traders may be interested in two of our trading guides – Traits of Successful Traders and Top Trading Lessons – while technical analysts are likely to be interested in our latest Elliott Wave Guide.
What is your view on Gold – bullish or bearish?? You can let us know via the form at the end of this piece or you can contact the author at nicholas.cawley@ig.com or via Twitter @nickcawley1.


