


AUSTRALIAN DOLLAR PRICE OUTLOOK FOR AUDUSD & AUDJPY:
- The Australian Dollar has enjoyed the market’s recent influx of risk appetite stemming from US-China trade war optimism and hopes for global stimulus
- AUDUSD approaches major confluence while AUDJPY looks set to test downtrend resistance
- Find out if you share the same Top Traits of Successful Traders
The Australian Dollar has notched an impressive rebound from decade lows printed last month as currency traders reassess the latest rhetoric surrounding the US-China trade war. We noted mid-August that AUDUSD & AUDJPY skyrocketed on tariff delay reports, but the move was short-lived as sentiment largely remained damaged.
A firm stance conveyed at the September RBA meeting followed by further upbeat headlines on the US-China trade war helped propel the Australian Dollar higher as volatility plunged and risk assets surged. The move to the upside in spot AUDUSD & AUDJPY is likely being exacerbated by news that China’s central bank – the PBoC – will cut its reserve requirement ratio (RRR) seeing that the monetary stimulus stands to unleash CNY 900 billion in liquidity.
AUDUSD PRICE CHART: DAILY TIME FRAME (JANUARY 17, 2019 TO SEPTEMBER 09, 2019)
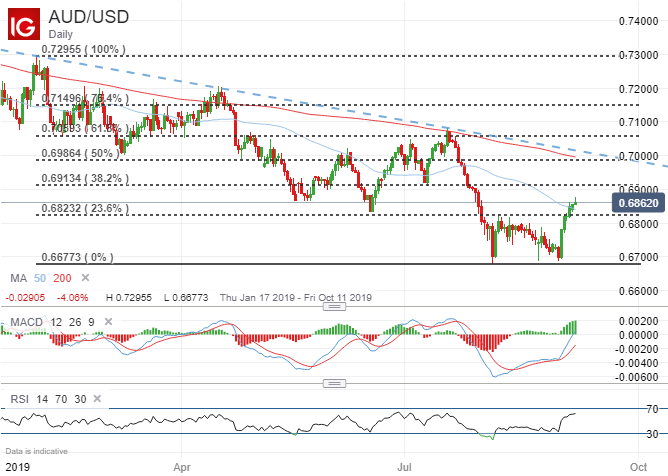
Barring no major shift in the fundamental landscape, forex traders may find solace turning to the charts for insight on where Australian Dollar price action heads next. Spot AUDUSD has cleared the 23.6% Fibonacci retracement level of its year-to-date trading range and will be constructive to hold this area of resistance-turned-support going forward. Also, topping the 50-day simple moving average was also a positive development for AUDUSD bulls. Yet, the swing lows printed by spot AUDUSD in May and June highlights major confluence that must be overcome for upward progression to continue as spot prices approach the 0.6900 handle.
AUDJPY PRICE CHART: DAILY TIME FRAME (APRIL 12, 2019 TO SEPTEMBER 09, 2019)

As for AUDJPY, this largely sentiment-driven currency pair is nearing bearish trend resistance extended from its April 16 and July 22 swing highs. This major technical obstacle stands to serve as a major headwind which could thwart the streak of gains currently on pace for 6-days straight. The 38.2% Fibonacci retracement level of AUDJPY’s bearish leg from April to August also underscores technical resistance faced by spot prices. Although, the 50-day simple moving average may be looked to for potential support now that AUDJPY has topped this area.
-- Written by Rich Dvorak, Junior Analyst for DailyFX.com
Connect with @RichDvorakFX on Twitter for real-time market insight


