


CRUDE OIL PRICE OUTLOOK IMPROVES ON CHINA ECONOMY STIMULUS & FADING RECESSION FEARS
- Crude oil prices jumped over 4% and above $56.00 as slowing global GDP growth and recession fears fade
- The price of oil may continue to climb so long as US-China trade war uncertainty remains muted
- Don’t miss out on the Top Crude Oil Facts Every Trader Should Know
We noted in our Q3 Crude Oil Forecast that the summer season of July through September was expected to be choppy in light of conflicting fundamental headwinds. The global macroeconomic backdrop, which largely drives demand for crude oil and prices, has been fixated predominantly on themes of accommodative monetary policy expectations aiming to offset slowing global growth in light of rising recession fears and lingering US-China trade war uncertainty. The latest Chinese economic data has painted a more sanguine picture of the global economy, however, which is largely boosting risk appetite and crude oil prices.
CRUDE OIL PRICE CHART: DAILY TIME FRAME (DECEMBER 19, 2018 TO SEPTEMBER 04, 2019)
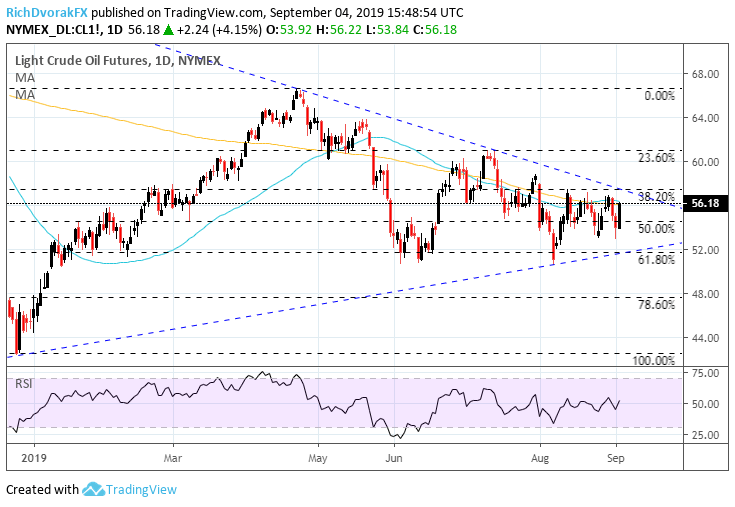
Chart created by @RichDvorakFX with TradingView
Furthermore, China’s government announced last night its desire to lower the country’s reserve requirement ratio (RRR) assessed on banks in hopes of boosting GDP growth by spurring liquidity and lending. The improvement in market sentiment and jump in crude oil prices could also be explained by traders reaccelerating rate cut bets from the Federal Reserve.
CRUDE OIL PRICE CLIMBS AS RECESSION EXPECTATIONS RECEDE JUDGING BY TREASURY YIELD CURVE
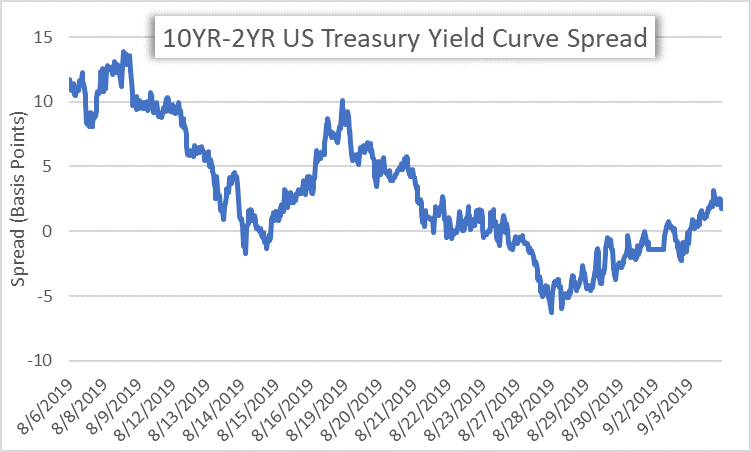
This has likely contributed to the recent US Treasury yield curve inversion pivoting back into positive territory measured by the spread between the 10-year and 2-year rates, which reflects improving economic prospects and receding recession worries. Yet, the latest crude oil price rebound may stall as recession fears remain elevated nonetheless and risks surrounding the US-China trade war escalating again still linger.
CRUDE OIL PRICE CHART: 4-HOUR TIME FRAME (JULY 31, 2019 TO SEPTEMBER 04, 2019)

Chart created by @RichDvorakFX with TradingView
Risk appetite improving and recession fears fading is also evidenced by the sizable drop in volatility. Crude oil volatility, measured via OVX – Cboe’s 30-day implied crude oil price volatility, has a strong inverse relationship with the price of oil which is reflected in the chart above. That said, further declines in measures of volatility may be supportive of higher crude oil prices. Although, as crude oil prices drift higher, major technical resistance near the $57.00 price level stands to keep upward momentum at bay.
This noteworthy area confluence is highlighted by the series of lower highs printed throughout August in addition to the commodity’s 78.6% Fibonacci retracement level of its trading range since July 31. Also, we have previously drawn attention to the technical obstacle posed by the potential moving average death cross of the 50-day and 200-day SMAs.
CRUDE OIL – IG CLIENT SENTIMENT INDEX PRICE CHART: DAILY TIME FRAME (MARCH 07, 2019 TO SEPTEMBER 04, 2019)

The potential for a bearish reversal in crude oil price action is also hinted at by the latest IG Client Sentiment data. Considering our typical contrarian view on crowd sentiment, crude oil prices may fall seeing that 70.0% of retail crude oil traders are net-long. Moreover, the number of traders net-long is 13.1% higher relative to last week whereas the number of traders net-short is 15.6% lower over the same period.
-- Written by Rich Dvorak, Junior Analyst for DailyFX.com
Connect with @RichDvorakFX on Twitter for real-time market insight


