


CANADIAN DOLLAR PRICE OUTLOOK EYES Q2 GDP DATA
- Canadian Dollar overnight implied volatility readings jump noticeably as forex traders anticipate the potential for sizable swings in spot rates
- USDCAD looks ripe for a technical break and Canada GDP data due for release during Friday’s trading session, which will likely weigh on BOC monetary policy, could spark the move
- Looking for potential trade ideas? Check out our Top Trading Opportunities for 2019
USDCAD has remained stubbornly committed to trading around the 1.33 handle following the head-fake breakdown beneath bullish trendline support earlier this week. We noted on Monday that Canadian Dollar outlook appeared set to rebound against its US counterpart, which materialized, but spot USDCAD quickly whipsawed back higher after bouncing off a key Fibonacci support level that we also highlighted. That said, the Canadian Dollar still looks ripe for major technical break given the current technical backdrop and just so happens to align with the upcoming release of Q2 Canada GDP data slated for Friday at 12:30 GMT which could serve as a fundamental catalyst sparking its next big move.
CANADIAN DOLLAR IMPLIED VOLATILITY & TRADING RANGES
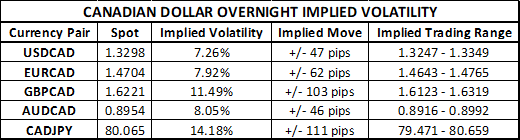
In light of the high-impact event risk surrounding the Canadian Dollar (details can be found on the DailyFX Economic Calendar here), the jump in overnight implied volatility readings is to be expected. Among the loonie crosses, CADJPY is expected to be the most active currency pair during Friday’s trading session with an overnight implied volatility reading of 14.18%. Expected CADJPY price action is elevated likely due to a slew of Japanese economic data on deck due for release later in today’s session at 23:50 GMT. GBPCAD is expected to be the second most active currency pair tomorrow with an overnight implied volatility reading of 11.49% and has climbed largely owing to the recent rise in no-deal Brexit fears.
CANADA ECONOMIC SURPRISE INDEX (CITI)
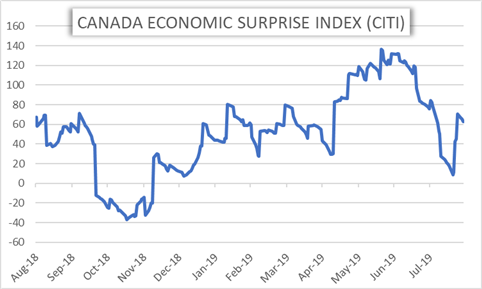
The reaction in the Canadian Dollar will ultimately depend on whether GDP data comes in line with the forex market’s expectations or catches traders off-guard. Turning to the Citi economic surprise index for Canada, we see that the data has generally been better-than-expected but economic strength appears to have waned since its recent peak back in early June. Nevertheless, whether the headline year-over-year Q2 Canada GDP data is reported above or below the 1.4% median consensus figure largely stands to dictate how the Bank of Canada (BOC) communicates its next monetary policy stance.
BANK OF CANADA INTEREST RATE MOVE PROBABILITIES (SEPTEMBER 2019)
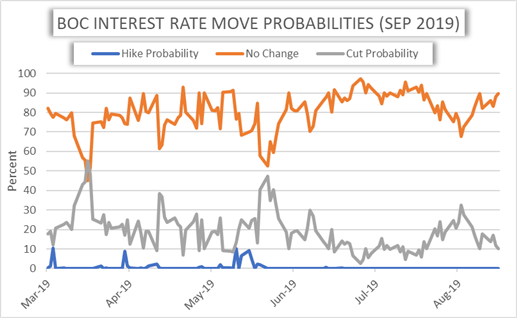
Although the BOC is not likely to make a move at the central bank’s September 4 meeting, a spike in the probability that Governor Poloz and the Governing Committee will decide to cut interest rates has serious potential to bog down the Canadian Dollar. Also, a particularly disappointing Q2 Canada GDP report could be the final anecdote that the Bank of Canada needs to justify a dovish pivot in policy.
USDCAD 25-DELTA RISK REVERSAL (OVERNIGHT)
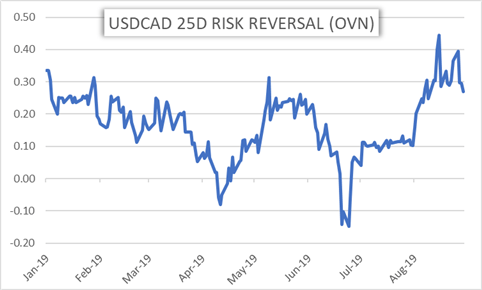
On the contrary, evidence of continued strength in the Canadian economy could keep the BOC on the sidelines and may be enough to encourage USDCAD bears to make a major push lower. Also,the sharp drop in USDCAD’s risk reversal reading is worth noting as it suggests that forex option traders are becoming less bullish on the currency pair. Yet, the risk reversal reading remains comfortably above 0 indicating that, on balance, the demand for call option volatility outweighs that of put options as traders seek spot USDCAD upside protection.
USDCAD PRICE CHART: DAILY TIME FRAME (MAY 27, 2019 TO AUGUST 29, 2019)

As mentioned in the opening paragraph, spot USDCAD looks geared for a technical breakdown. A major area of confluence has developed around the 1.3300-1.3350 price zone which remains a daunting headwind for potential upside in spot USDCAD. Although, support provided by the mid-point retracement level of the currency pair’s June-August trading range could provide a degree of buoyancy to spot prices. More importantly, the struggle for USDCAD to make a solid break beneath its 200-DMA may warrant paying more attention to as price action unfolds – particularly if an overall solid Q2 Canada GDP report fails to send spot USDCAD lower.
-- Written by Rich Dvorak, Junior Analyst for DailyFX.com
Connect with @RichDvorakFX on Twitter for real-time market insight
https://www.dailyfx.com/central-bank-calendar?ref=dvorak


