

Australian Dollar Outlook:
- Risk assets have enjoyed a boost over the last two sessions as trade war concerns recede
- Further, China announced it will not retaliate to the most recent tariff escalation which should have boosted the Australian Dollar
- Interestingly, AUDUSD has traded lower and client positioning suggests it may continue to slump
VIX Slump Signals Risk Appetite, but Australian Dollar Outlook Remains Bleak
The VIX sank nearly 20% since Tuesday trading while risk assets, including emerging market equities with trade war ties, ticked higher. The Australian Dollar has historically maintained an inverse correlation to the VIX Index but has continued lower in the last two sessions nonetheless. With recovering risk appetite and a potential improvement in the US-China trade war on the horizon, why has AUDUSD remained pressured?
Australian Dollar Price Chart: Daily Time Frame (December 2018 – August 2019) (Chart 1)

Chart created with TradingView. AUDUSD overlaid with VIX in orange and their correlation in blue.
First and foremost, traders might be suspicious of the efficacy of the upcoming US-China talks. Previous meetings have resulted in little progress, so market participants could be voicing their apprehension and ditching AUDUSD despite forthcoming negotiations. Similarly, the Australian Dollar's outlook could also be bogged down by the potential for further RBA rate cuts. While the Federal Reserve has undoubtedly struck a dovish tone, the Reserve Bank of Australia is more dovish still. A recent reduction in the odds of a 50-basis point cut at the September FOMC meeting could have tipped the scales even further. Therefore, a weakening AUDUSD spot price is understandable in regard to monetary policy.

Whatever the dominating concern may be, IG Client positioning data suggests AUDUSD may continue to fall. Retail trader data shows 73.8% of traders are net-long with the ratio of traders long to short at 2.82 to 1. In fact, traders have remained net-long since Jul 19 when AUDUSD traded near 0.70195; price has moved 4.1% lower since then. The number of traders net-long is 0.4% lower than Wednesday and 1.7% lower from last week, while the number of traders net-short is 9.0% lower than Wednesday and 2.2% lower from last week.
Australian Dollar Price Chart: 4 – Hour Time Frame (April – August) (Chart 2)
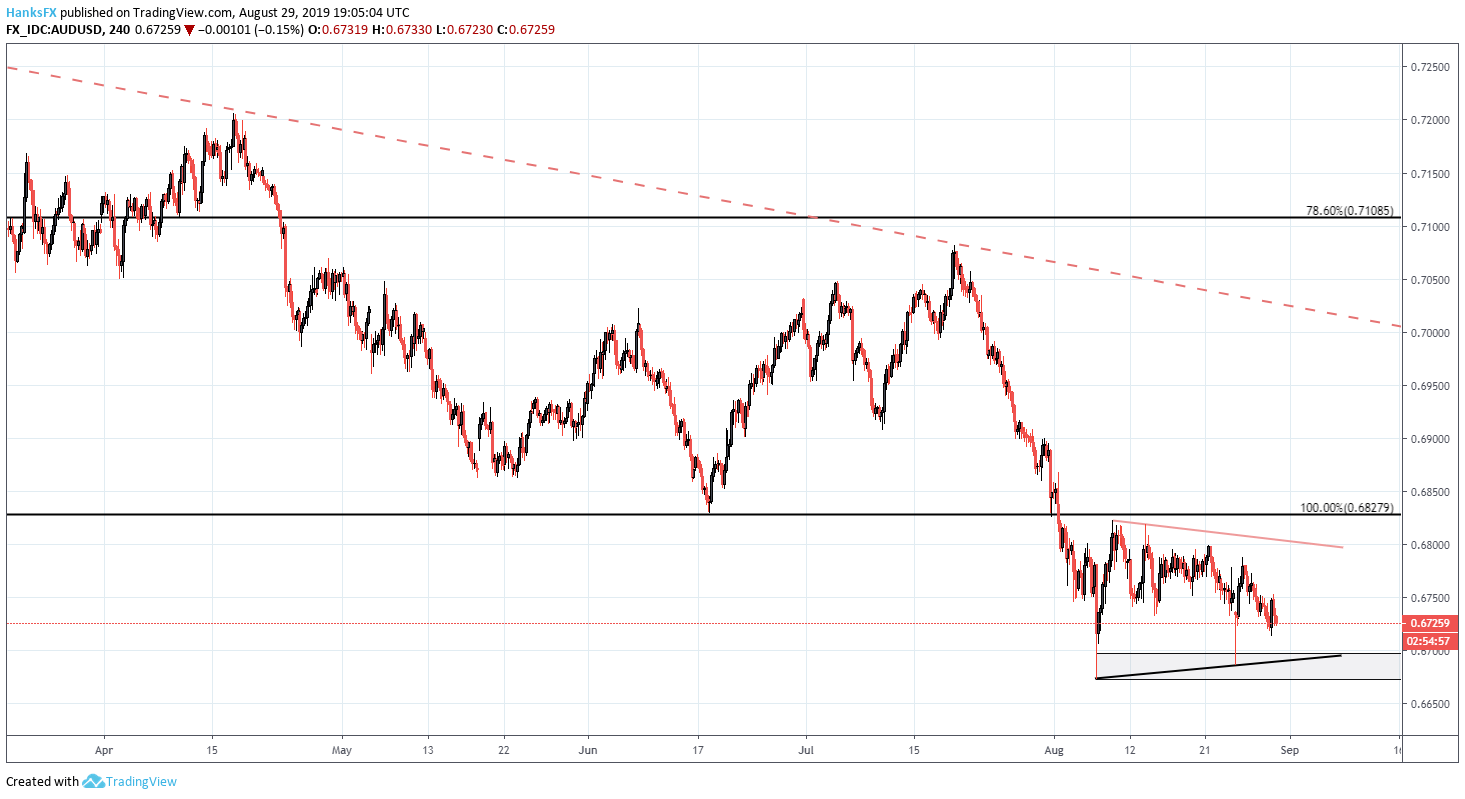
Chart created with TradingView
We typically take a contrarian view to crowd sentiment, and the fact traders are net-long suggests AUDUSD spot prices may continue to feel pressure. Traders are further net-long than yesterday and last week, and the combination of current sentiment and recent changes gives us a stronger AUDUSD-bearish contrarian trading bias. Continued AUDUSD bearishness could see the Australian Dollar test recent support beneath 0.67 and potentially probe August 7 lows around 0.6674. For a deeper look at client positioning data and how to incorporate it into your trading strategy, follow @PeterHanksFX on Twitter.
--Written by Peter Hanks, Junior Analyst for DailyFX.com
Contact and follow Peter on Twitter @PeterHanksFX
Read more: Gold Price Forecast: Rally to Receive Boost from Massive ETF Holdings