


CRUDE OIL PRICE ACTION REMAINS WEAK ON ELEVATED RECESSION RISK
- The price of crude oil has rebounded so far this week, but selling pressure may soon resume
- Crude oil prices stand to succumb to lingering recession fears and slowing global GDP growth expectations as the 2s10s yield curve inversion deepens
- Check out these Top Crude Oil Facts or download our free educational guide covering the Key Fundamentals of Crude Oil Trading
The price of crude oil is modestly higher so far during Tuesday’s trading session as the commodity continues to stage an attempt at recovering from last week’s selloff. I noted in my crude oil price weekly technical forecast published over the weekend that bearish headwinds would likely persist as US-China trade war risks linger, which still stands despite yesterday’s reported de-escalation. The retracement higher in crude oil may soon stall, however, as recession fears rattle sentiment owing to the deepening yield curve inversion along the 2-year and 10-year maturities.
CRUDE OIL PRICE CHART: DAILY TIME FRAME (DECEMBER 19, 2018 TO AUGUST 27, 2019)
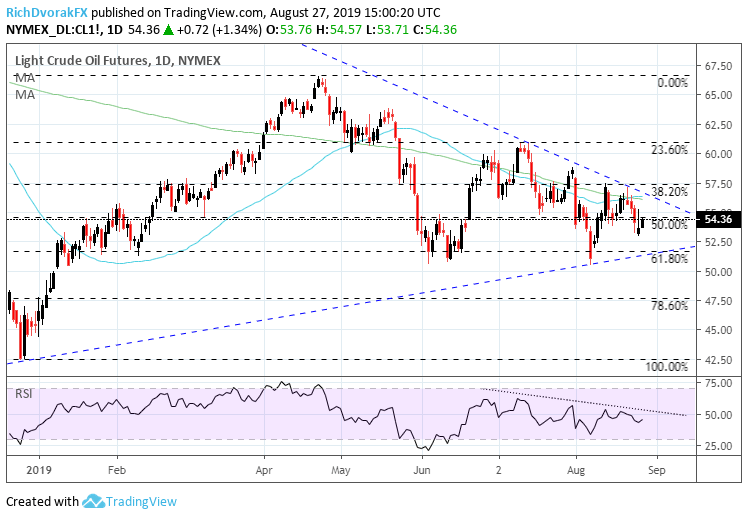
Chart created by @RichDvorakFX with TradingView
Crude oil prices continue to gravitate around technical confluence near the 54.50 price level which happens to be the mid-point of the commodity’s bullish leg from December to late April. Downside bias over the near-term remains intact so long as crude oil prices struggle to eclipse this level of technical resistance. If this zone can be topped, however, crude oil prices may push higher to test the bearish trendline extended from the swing highs printed on July 15 and August 21
Yet, the negative sloping 200-day simple moving average likely stands to keep upward price action at bay as well. Furthermore, the more sensitive 50-day simple moving average risks turning back below the 200-day simple moving average which stands to trigger bearish price action owing to the possibility of a looming “death-cross.” Crude oil’s RSI trending lower and failing to reclaim a reading above 50 points to the commodity’s waning bullish prospects. That said, technical confluence around the 52.50 area could serve as a potential downside target where crude oil prices may find support from the 61.8% Fib and bullish trendline.
CRUDE OIL PRICE CHART: 4-HOUR TIME FRAME (JULY 30, 2019 TO AUGUST 27, 2019)
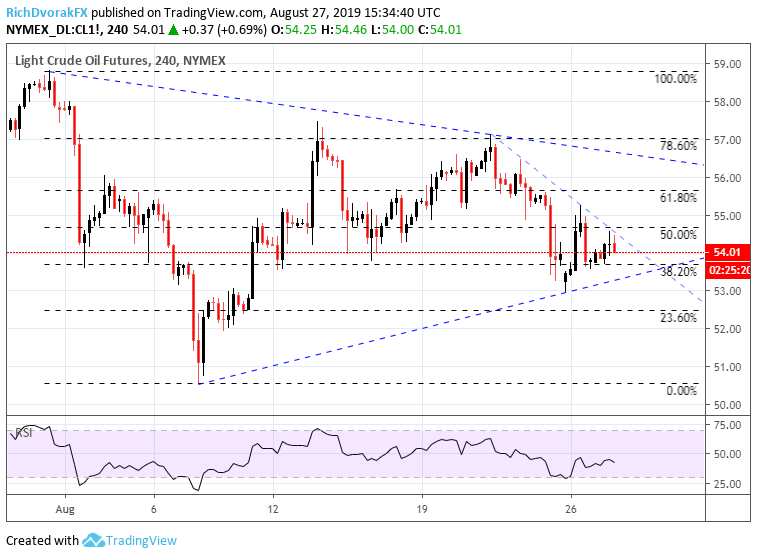
Chart created by @RichDvorakFX with TradingView
Taking a look at the price of crude oil from a closer perspective underscores the choppy trading range recorded so far this month. Fibonacci retracement levels highlighted on the chart above reveal potential areas of confluence as crude oil price action progresses with the commodity drifting lower along its short-term bearish trendline formed since August 21. Above this trendline, crude oil bulls could look to target the 55.00 area where prices have previously consolidated.
That said, bearishness could be reiterated if crude oil prices sink below support posed by the 38.2% Fib and uptrend line drawn from its intraday lows recorded on August 7 and August 25. If selling pressure accelerates and pushes the commodity below confluent support around the 23.6% Fibonacci retracement level, crude oil prices could potentially retest the month-to-date lows.
OVX – CRUDE OIL VOLATILITY INDEX PRICE CHART: DAILY TIME FRAME (JANUARY 30, 2019 TO AUGUST 27, 2019)

Chart created by @RichDvorakFX with TradingView
Crude oil prices, like that of many risk assets, tend to hold an inverse relationship with volatility. Crude oil volatility – measured via OVX, Cboe’s 30-day implied volatility of crude oil prices – has begun drifting lower since last week’s spike. As such, this could suggest that downward pressure on crude oil prices could soon fade. Then again, the correlation between spot crude and oil volatility is turning less negative and indicates that the historical relationship may hold less credence going forward.
-- Written by Rich Dvorak, Junior Analyst for DailyFX.com
Connect with @RichDvorakFX on Twitter for real-time market insight


