


CANADIAN DOLLAR PRICE CHART OUTLOOK HINTS AT LOONIE UPSIDE
- USDCAD technicals could be pointing to a reversal lower if the currency pair’s prevailing uptrend fails to hold
- The Canadian Dollar seems oversold and has potential to rebound
- Interested in becoming a currency trader? Check out this free Forex for Beginners educational guide
Spot USDCAD has been in a steady uptrend since mid-July, but recent bullish progression could be coming under pressure. The Canadian Dollar has edged lower against its USD counterpart in an apparent retracement of June’s sizable slide to the downside, but price action seems to be showing signs of losing steam. The recovery in spot USDCAD off its July low was initially thwarted around the 1.3355 area as prices approached the 61.8% Fibonacci retracement level of its last bearish leg recorded throughout June.
USDCAD PRICE CHART: DAILY TIME FRAME (MAY 14, 2019 TO AUGUST 26, 2019)
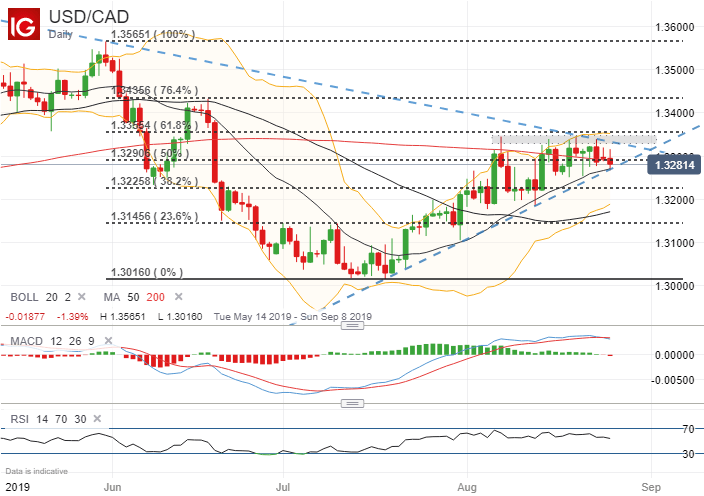
Looking at the daily candlesticks, we can see sellers stepping in around this price level so far this month indicated by the long upper wicks. That said, USDCAD is currently trading around the 1.3280 mark and is testing bullish trendline support extended from the series of higher-lows since July 18. If this overarching uptrend fails to keep spot USDCAD bid, the Canadian Dollar could soon reverse and drive the currency pair back lower.
Spot USDCAD technical resistance is also posed by the negative sloping 50-day simple moving average which threatens to weigh heavily on price action. Also, selling pressure becomes more evident with the latest drop in spot USDCAD below its mid-point retracement level. The potential of spot USDCAD reversing lower is also hinted at by the latest MACD crossover and ebbing RSI. If spot USDCAD confirms a break below the aforementioned uptrend line, a potential downside target could eye the 38.2% Fibonacci retracement level and confluent support around the 1.3200 handle.
USDCAD – IG CLIENT SENTIMENT INDEX PRICE CHART: DAILY TIME FRAME (FEBRUARY 27, 2019 TO AUGUST 26, 2019)
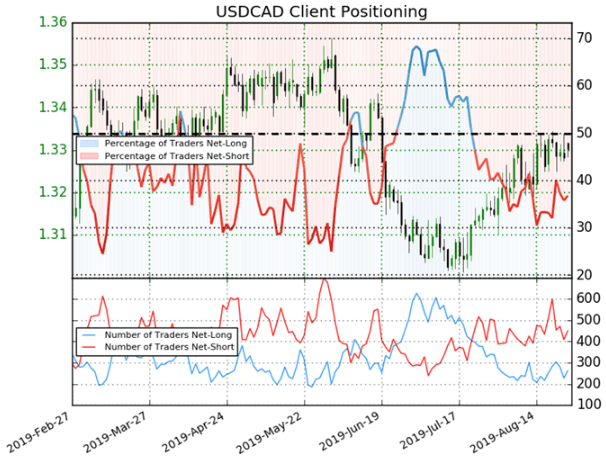
According to IG Client Sentiment data, 36.8% of spot USDCAD retail traders are net-long resulting in a long-to-short ratio of -1.72 to 1. The number of traders net-long is 14.4% higher than yesterday while the number of traders net-short is 0.7% lower. Although we generally hold a contrarian view regarding crowd sentiment, the recent changes in spot USDCAD positioning could suggest that the currency pair’s price trend may soon reverse lower.
-- Written by Rich Dvorak, Junior Analyst for DailyFX.com
Connect with @RichDvorakFX on Twitter for real-time market insight


