


US-China Trade Tariffs, Crude Oil Price, Analysis and Chart:
- The US put recently announced Chinese trade tariffs on the backburner.
- Technical support under pressure.
Q3 2019 Goldand Oil Forecasts and Top Trading Opportunities
The DailyFX Calendar covers all important market moving data releases and events.
Crude Oil Jumps as US-China Trade Tensions Cool
Financial markets turned risk-on mid Tuesday afternoon after the US said that it would postpone putting a 10% tariff on $300 billion of Chinese goods until December 15 from September 1. The move set financial markets moving with risk-off assets, including gold, the Japanese Yen and Swiss France, tumbling while risk-on assets including equities and oil surged. Oil has been under downside pressure of late on fears that the ongoing trade war between the US and China is negatively impacting global growth, cutting demand for oil. While the tariff delay is welcome, unless there is some movement by both sides at talks scheduled in September, yesterday’s announcement may well be just a ‘can-kicking’ exercise by US President Donald Trump.
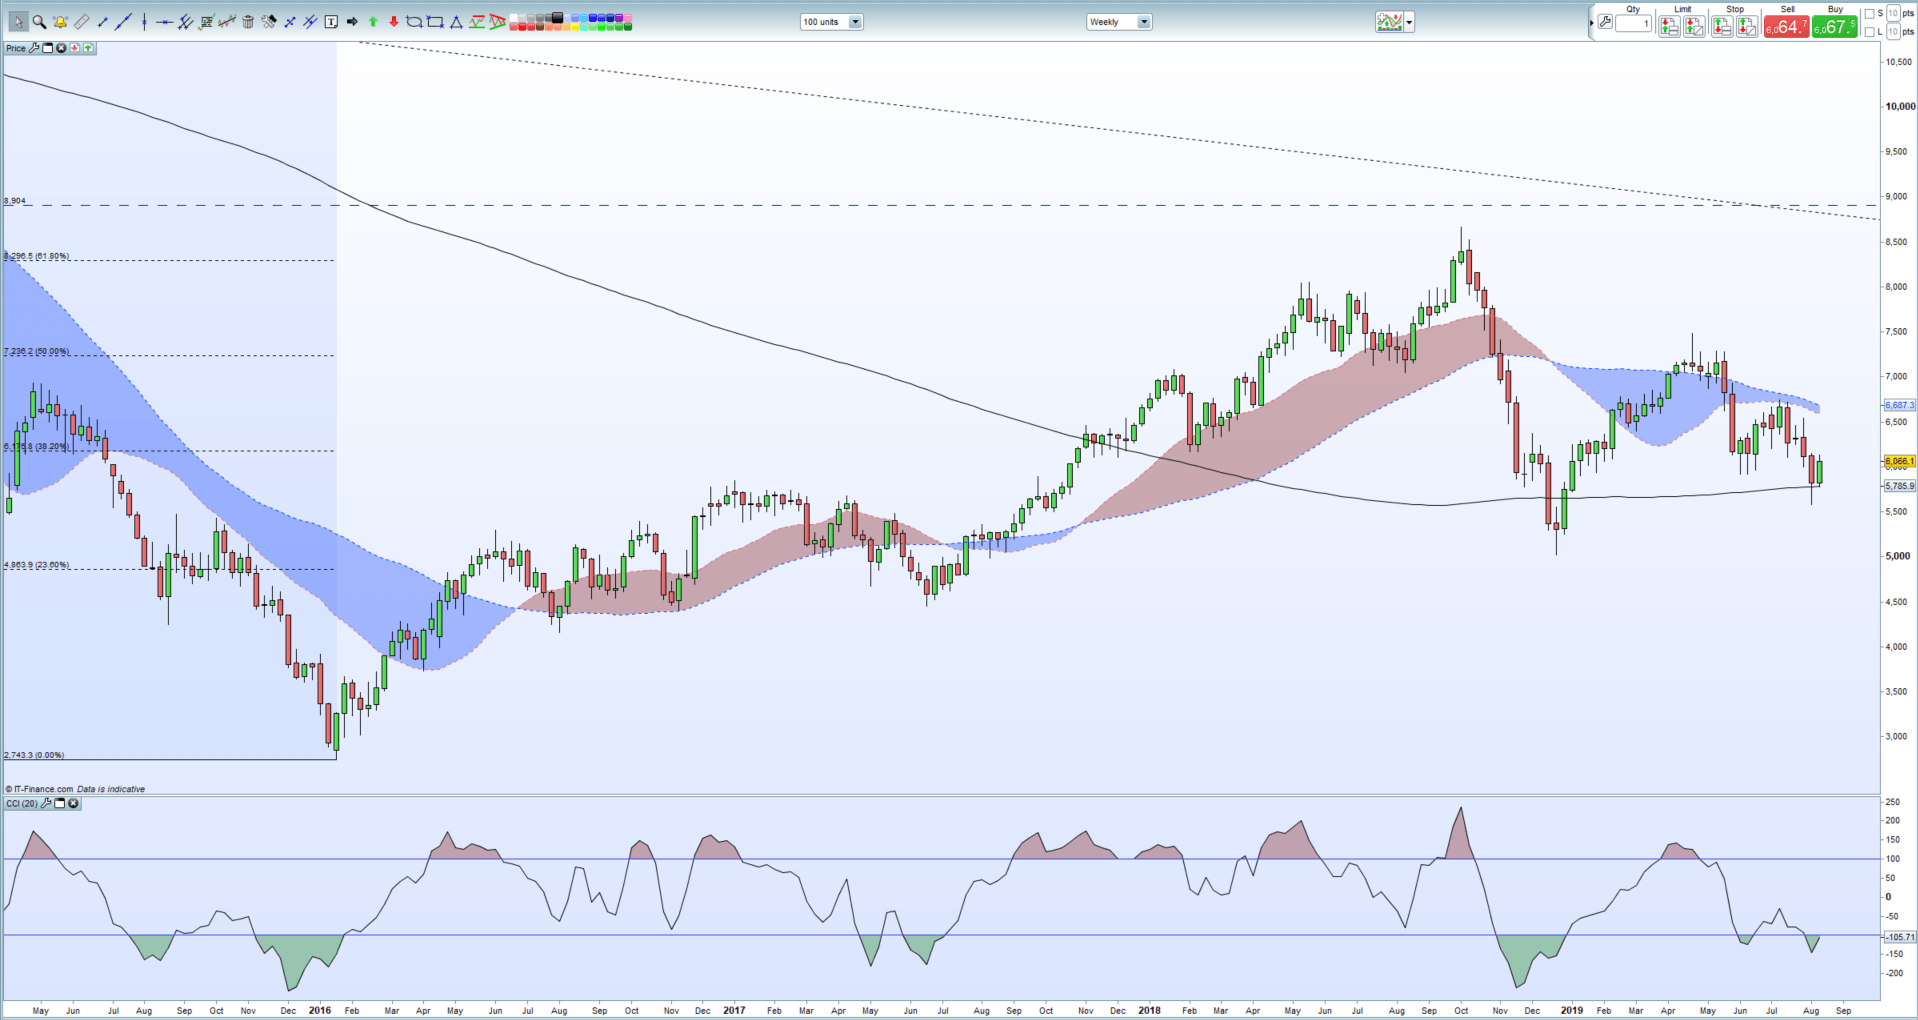
The weekly chart shows oil being supported by the 200-day moving average, an indicator last broken at the end of December 2018. On the weekly chart this kicks in around $57.75/bbl. and may offer support for oil in the coming weeks. The CCI indicator also shows oil in oversold territory, albeit moving higher.
Crude Oil Weekly Price Chart (May 2015 – August 14, 2019)
How to Trade Oil: Crude Oil Trading Strategies & Tips
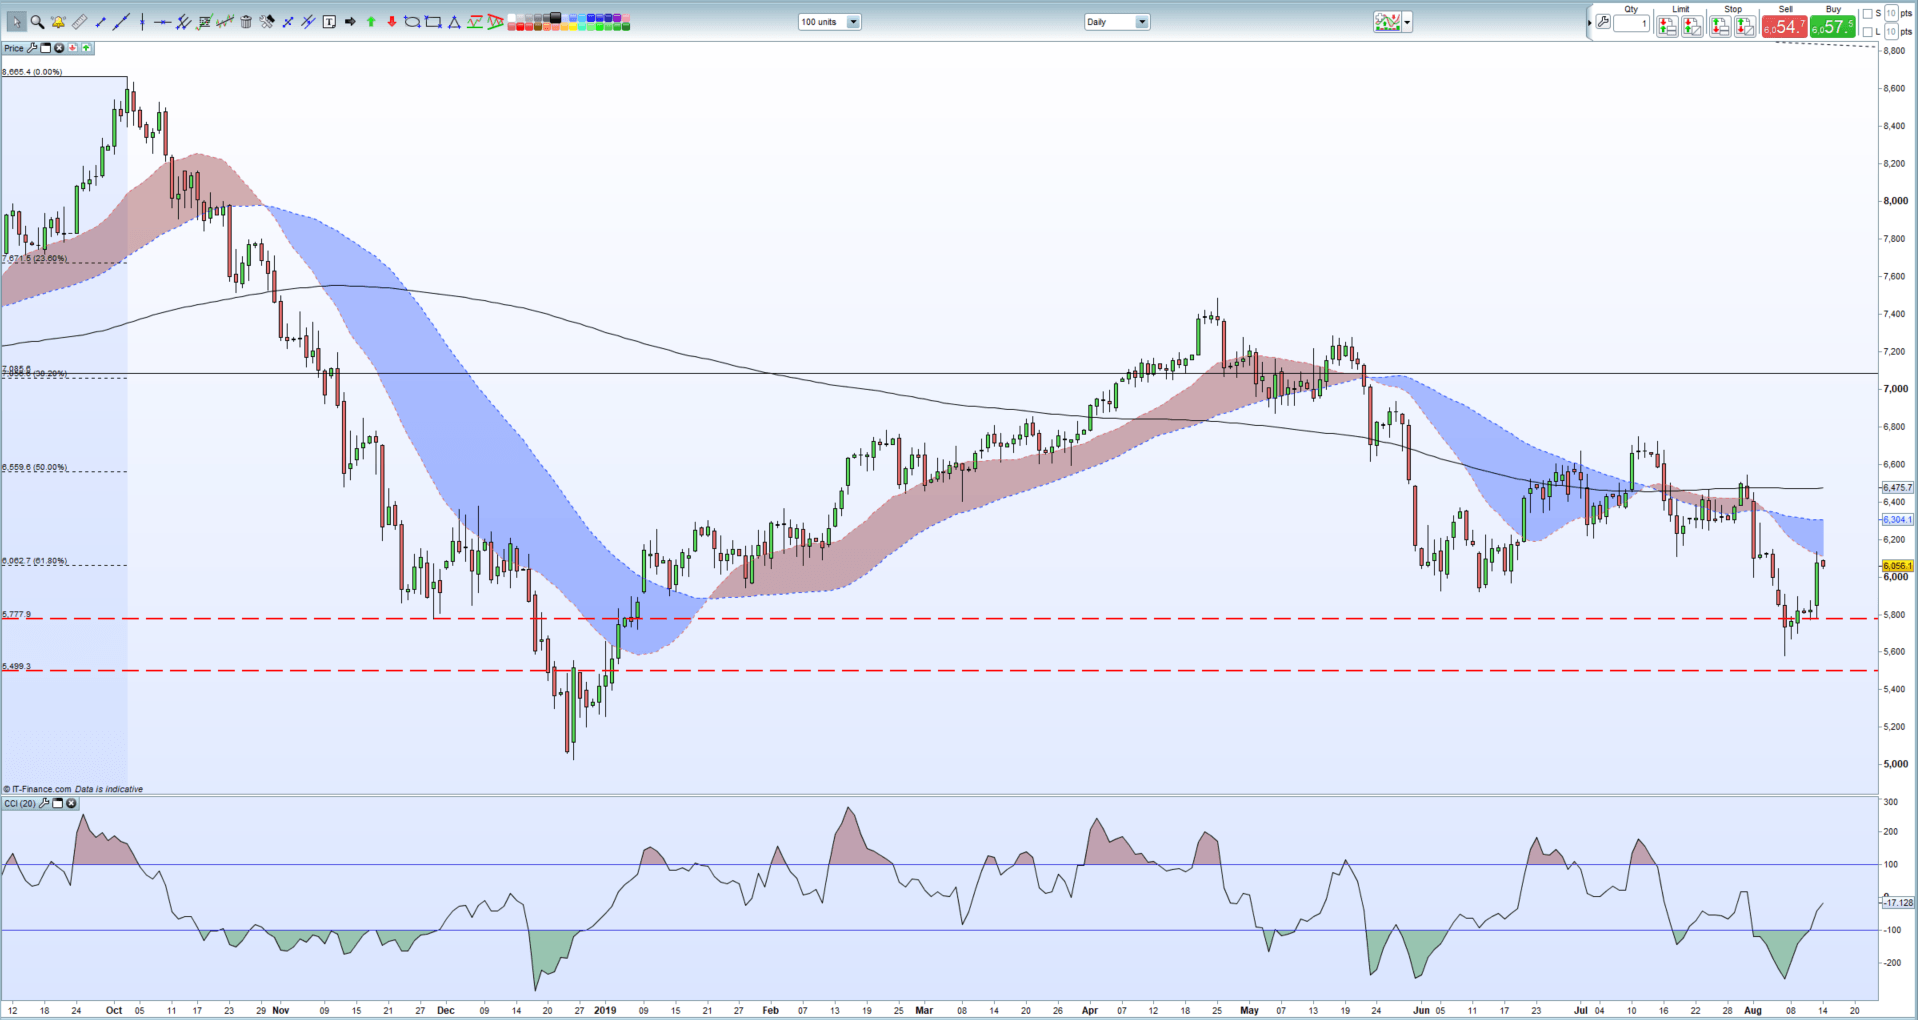
On the daily chart, oil is now trading either side of 61.8% Fibonacci retracement at $60.63/bbl. and needs to make a break to decide the next short-term move. The CCI indicator is now mid-market after moving sharply out of oversold territory, while the current spot price is nearing both the 20- and 50- day moving averages between $61.00/bbl. and $63.00/bbl. In the short-term the price may struggle to break appreciably higher.
Crude Oil Daily Price Chart (September 2018 – August 14, 2019)
Traders may be interested in two of our trading guides – Traits of Successful Traders and Top Trading Lessons – while technical analysts are likely to be interested in our latest Elliott Wave Guide.
What is your view on Oil – bullish or bearish?? You can let us know via the form at the end of this piece or you can contact the author at nicholas.cawley@ig.com or via Twitter @nickcawley1.


