


Singapore Dollar, USD/SGD, Monetary Authority of Singapore Talking Points
- Singapore Dollar appreciates despite 2019 GDP outlook downgrade
- Its strength points to what seems to be inaction from the MAS for now
- USD/SGD may rise ahead as trade wars fuel ASEAN capital outflows
Trade all the major global economic data live as it populates in the economic calendar and follow the live coverage for key events listed in the DailyFX Webinars. We’d love to have you along.
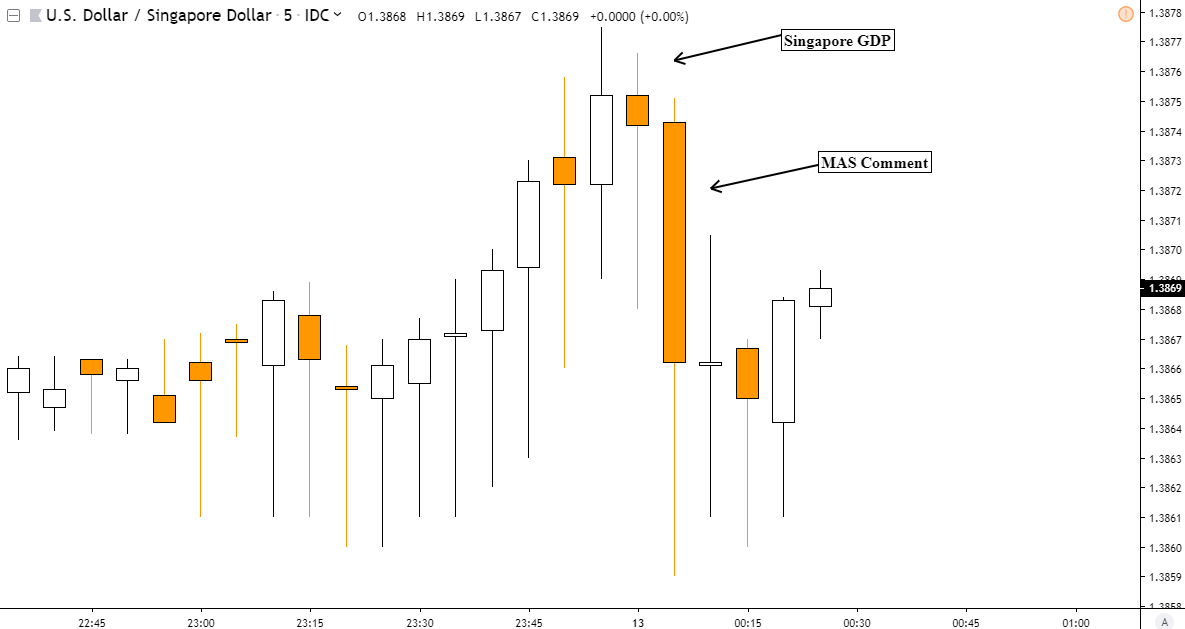
Singapore Dollar Gains Despite Local Downgrade in GDP Estimates
The US Dollar weakened against the SGD despite the Singapore government downgrading forecasts for 2019 GDP, but USD may recover ahead. This accompanied the finalized reading of second quarter growth which showed Singapore’s economy shrinking 3.3% q/q, worse than the -2.9% consensus and slightly less severe than the -3.4% preliminary estimate. This was also the largest contraction since 2012.
According to the Ministry of Trade, growth may slow to a standstill as GDP is anticipated to clock in between a range of 0.0% - 1.0% this year. This is compared to the prior 1.5% - 2.5% estimate. Reasons for these adjustments include the “challenging external macroeconomic backdrops” and the “deepening downturn in the global electronics cycle”.
Despite these revisions, the Monetary Authority of Singapore (MAS) said that it is not considering an off-cycle policy meeting. Deputy MD Edward Robinson added that their monetary policy stance is unchanged. Thus the strength in the Singapore Dollar, despite these gloomy economic prospects from the city state, was likely as a result of what could be inaction from the central bank at this moment in time.
However, there sill remain downside risks to SGD. The most notable is the threat of capital fleeing emerging markets and the ASEAN region amidst escalating US-China trade tensions. Over the past 24 hours, we have seen the latter nation show signs of standing its ground against threats from US President Donald Trump to impose additional tariffs come September. The US Dollar could thus extend its advance on haven demand.
USD/SGD 5-min Chart
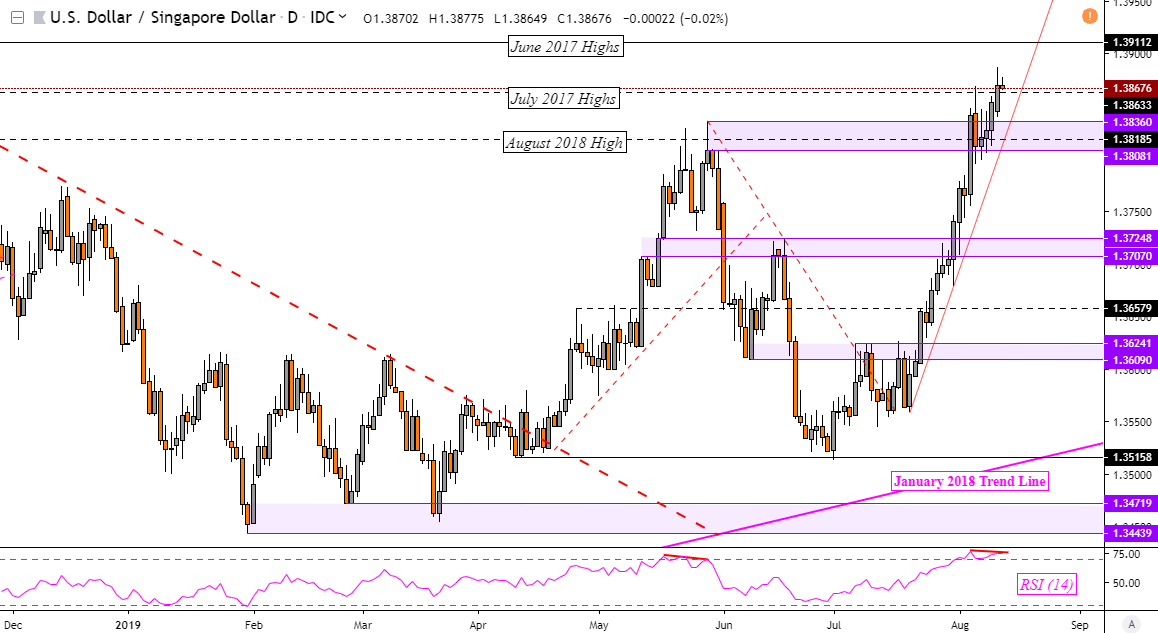
USD/SGD Technical Analysis
Taking a look at the USD/SGD daily chart, the dominant uptrend since July still remains intact after prices closed above highs from July 2017. This has exposed the peak in June from the same year at 1.3911. Negative RSI divergence does show fading upside momentum which can precede a turn lower. If that occurs, it opens the door to testing support at a range between 1.3808 and 1.3836.
USD/SGD Daily Chart
Singapore Dollar Trading Resources
- Just getting started? See our beginners’ guide for FX traders
- Having trouble with your strategy? Here’s the #1 mistake that traders make
--- Written by Daniel Dubrovsky, Currency Analyst for DailyFX.com
To contact Daniel, use the comments section below or @ddubrovskyFX on Twitter


