


EURUSD VOLATILITY RISES WITH US INFLATION, EURO ECONOMIC SENTIMENT DATA ON DECK
- EURUSD overnight implied volatility jumps to multi-week highs as forex traders eye Tuesday’s release of US CPI data and ZEW’s Eurozone economic sentiment survey
- US inflation that remains tepid and persistently pessimistic Eurozone outlook will likely weigh on expectations for additional monetary stimulus from the Federal Reserve (Fed) and European Central Bank (ECB)
- IG Client Sentiment data on spot EURUSD indicates that the recent price trend could soon reverse higher
EURUSD continues to show signs of attempting to rebound higher and Tuesday’s trading session could provide forex traders with additional evidence that the Euro may be putting in a bottom against the US Dollar. Although central bank dovishness is being felt across the market, the rise in Fed rate cut bets are anticipated to outweigh those for the ECB which could help spot EURUSD solidify its footing above the 1.12 handle. As such, spot EURUSD will likely turn to upcoming Eurozone ZEW economic sentiment and US inflation report data releases for insight on the currency pair’s next direction.
EURUSD 25-DELTA OVERNIGHT RISK REVERSAL CHART: DAILY TIME FRAME (FEBRUARY 11, 2019 TO AUGUST 12, 2019)
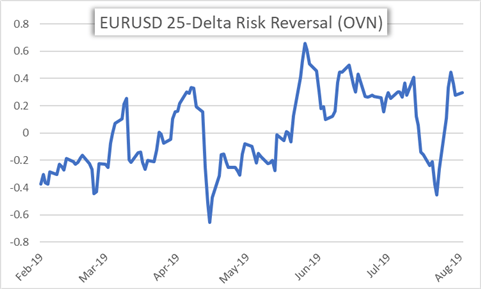
Risk reversal metrics for EURUSD, which have soared since President Trump threatened additional tariffs on China in the latest US-China trade war escalation earlier this month, hints at the growing demand for call options and upside protection relative. A reading above 0 indicates the premium for call option volatility exceeds the premium for put option volatility. Thus, the EURUSD overnight risk reversal reading of 0.295 implies that currency option traders have a bullish bias regarding spot prices by contract expiry Tuesday.
ZEW EUROZONE ECONOMIC SENTIMENT SURVEY CHART: MONTHLY TIME FRAME (AUGUST 2013 TO AUGUST 2018)
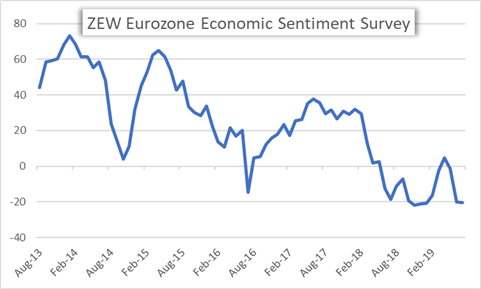
Yet, spot EURUSD selling pressure could be sparked if another downbeat ZEW Economic Sentiment Survey out of the EU sinks the Euro. The headline ZEW survey figure for August, which is slated for release at 9:00 GMT according to the DailyFX Economic Calendar, has remained subdued around -20 since October 2018 aside from briefly turning positive for a month this past April. Another sharp drop in the indicator could foretell further deterioration in the Eurozone’s already-sluggish economy, which has potential to accelerate expectations for ECB stimulus.
US INFLATION – CORE CPI YEAR OVER YEAR: MONTHLY TIME FRAME (JANUARY 2015 TO AUGUST 2019)
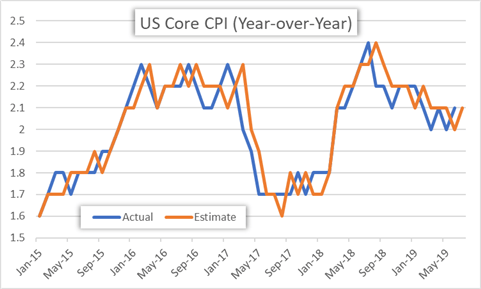
Spot EURUSD price action could whipsaw or intensify later in Tuesday’s trading session if July US inflation data generates a response when released at 12:30 GMT. Stubbornly-tame inflation has become a growing concern of the Federal Reserve and a primary factor contributing to the July FOMC meeting interest rate cut along with US-China trade war uncertainty. If the reading on core CPI comes in below consensus estimates of 2.1%, it could spur additional Fed rate cut bets and drag down the US Dollar.
SPOT EURUSD PRICE CHART: DAILY TIME FRAME (DECEMBER 25, 2018 TO AUGUST 12, 2019)

That said, EURUSD overnight implied volatility reading of 6.91% sets the currency pair’s 1-standard deviation trading range at 1.1172-1.1254. EURUSD bulls will likely look to technical resistance posed by the 38.2% Fibonacci retracement of its year-to-date high and low before eying the upper bound of the option implied trading range. Looking to potential downside in spot EURUSD, the envelope of moving averages could provide a degree of buoyancy for prices. However, EURUSD bears could target the psychologically-significant 1.12 handle before driving spot prices to test the lower bound of the option implied trading range or technical support provided by the 23.6% Fib.
EURUSD – IG CLIENT SENTIMENT INDEX PRICE CHART: DAILY TIME FRAME (FEBRUARY 13, 2019 TO AUGUST 12, 2019)
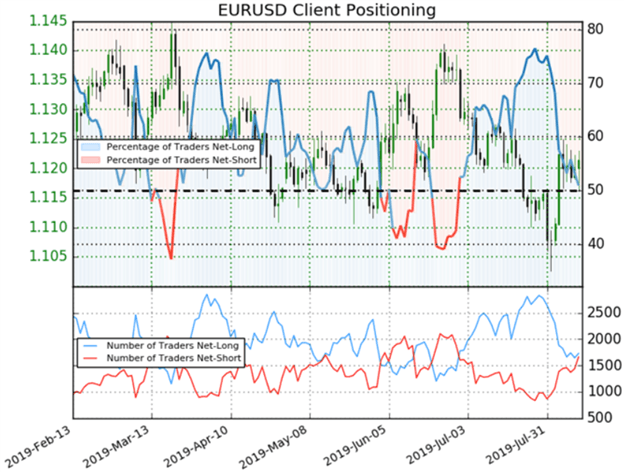
According to IG Client Sentiment data, 51.0% of spot EURUSD retail traders are net-long with the ratio of longs-to-shorts at 1.04. The number of traders net-long is 21.4% lower than last week whereas the number of traders net-short is 38.8% higher than last week. Recent changes in sentiment warn that the current EURUSD price trend may soon reverse higher despite the fact traders remain net-long seeing that we typically take a contrarian view on crowd sentiment.
-- Written by Rich Dvorak, Junior Analyst for DailyFX.com
Connect with @RichDvorakFX on Twitter for real-time market insight


