


Gold (XAU) Price, Silver (XAG) Price Analysis and Chart
Q3 2019 Gold Forecast and Top Trading Opportunities
Gold Rally Pauses but Underlying Market Remains Firm
As we start the week, gold is trading around $1,490/oz. off its recent multi-year high but still firmly in positive territory after the recent upsurge. The fundamentals behind the recent move remain in place and while the price may be edging lower, a period of consolidation, or price correction, is needed before the next move higher.
Gold Price Weekly Forecast: Bullish Breakout Remains In-Play
On the charts, the 61.8% Fibonacci level at $1,492/oz. has just been broken but remain in-plays while the recent high/low either side of $1,472/oz should provide support if the price continues to fade lower. Overall the chart remains positive, trading above all three moving averages, while gold has moved back out of the overbought zone.
The DailyFX Calendar covers all important market moving data releases and events.
Gold Price Daily Chart (February - August 12, 2019)
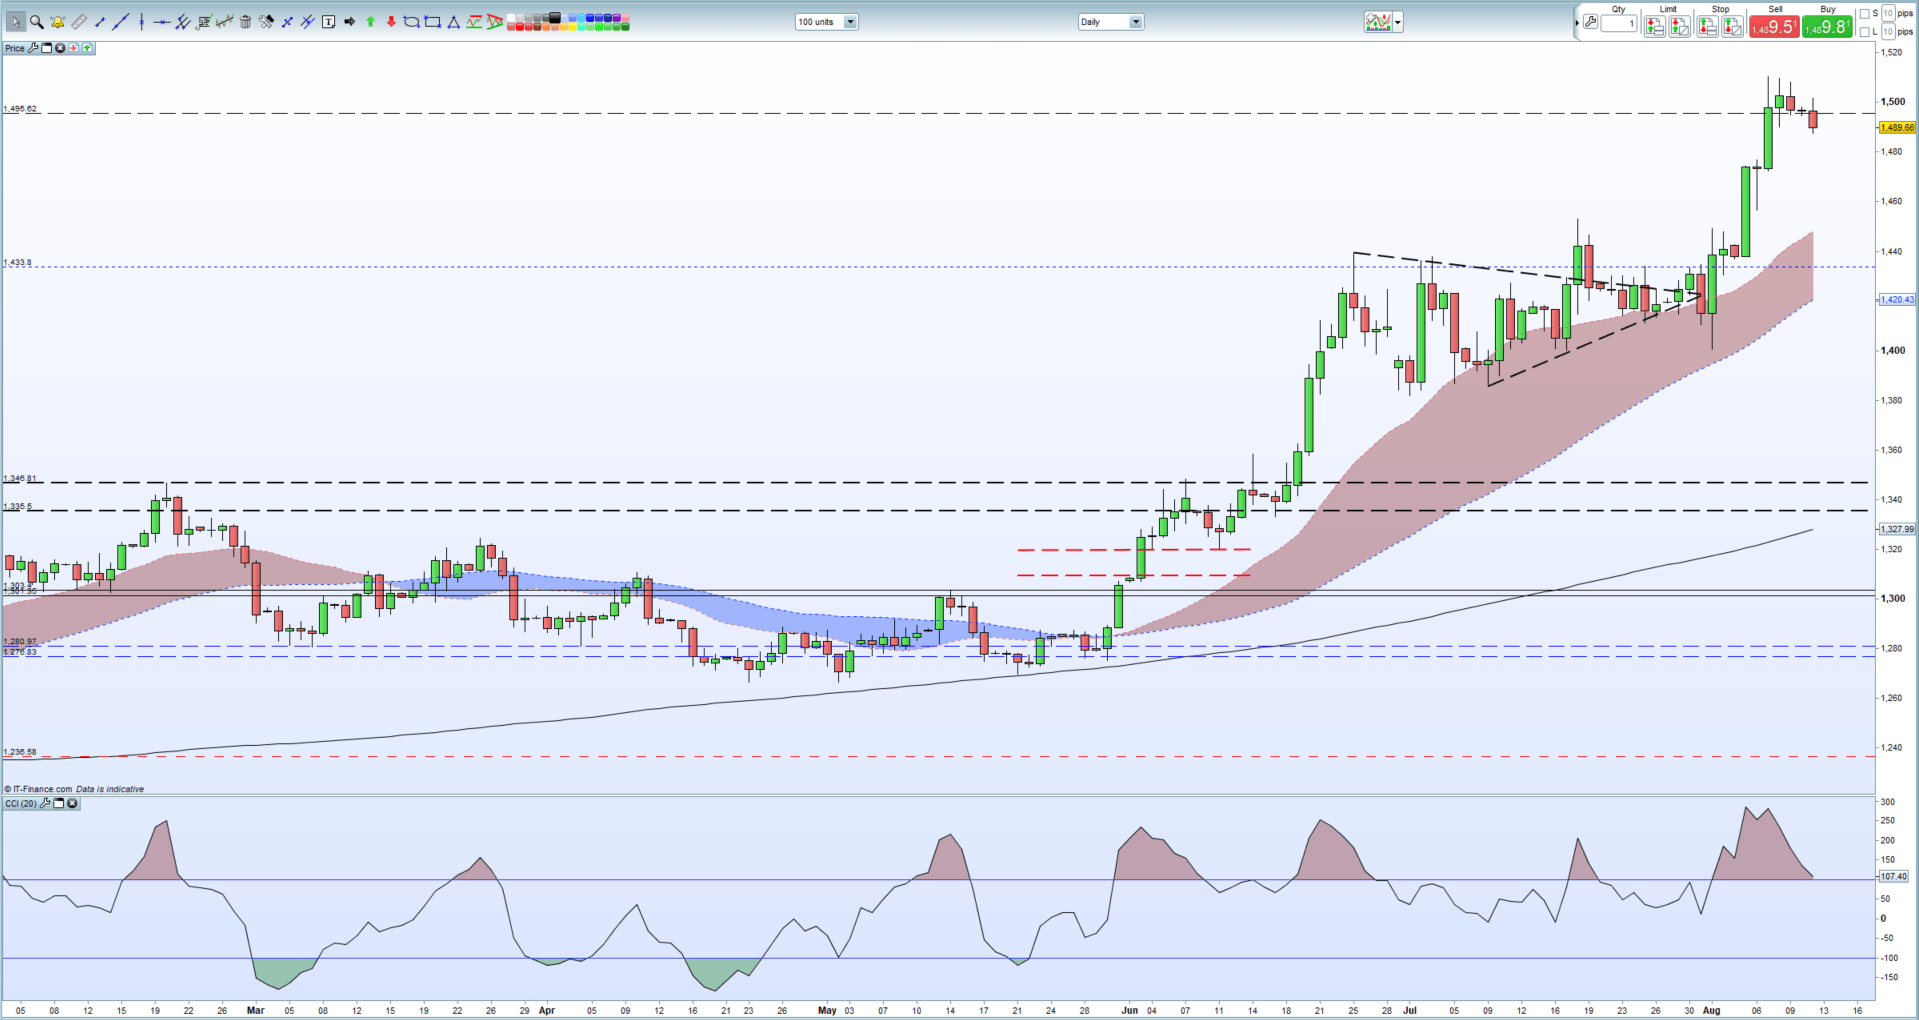
IG Client Sentiment data show that 61.3% of retail traders are net-long of gold, a bearish contrarian indicator. However, recent daily and weekly positional changes give us a bullish contrarian bias.
How to Trade Gold: Top Gold Trading Strategies and Tips
Silver Eyes Support Zone
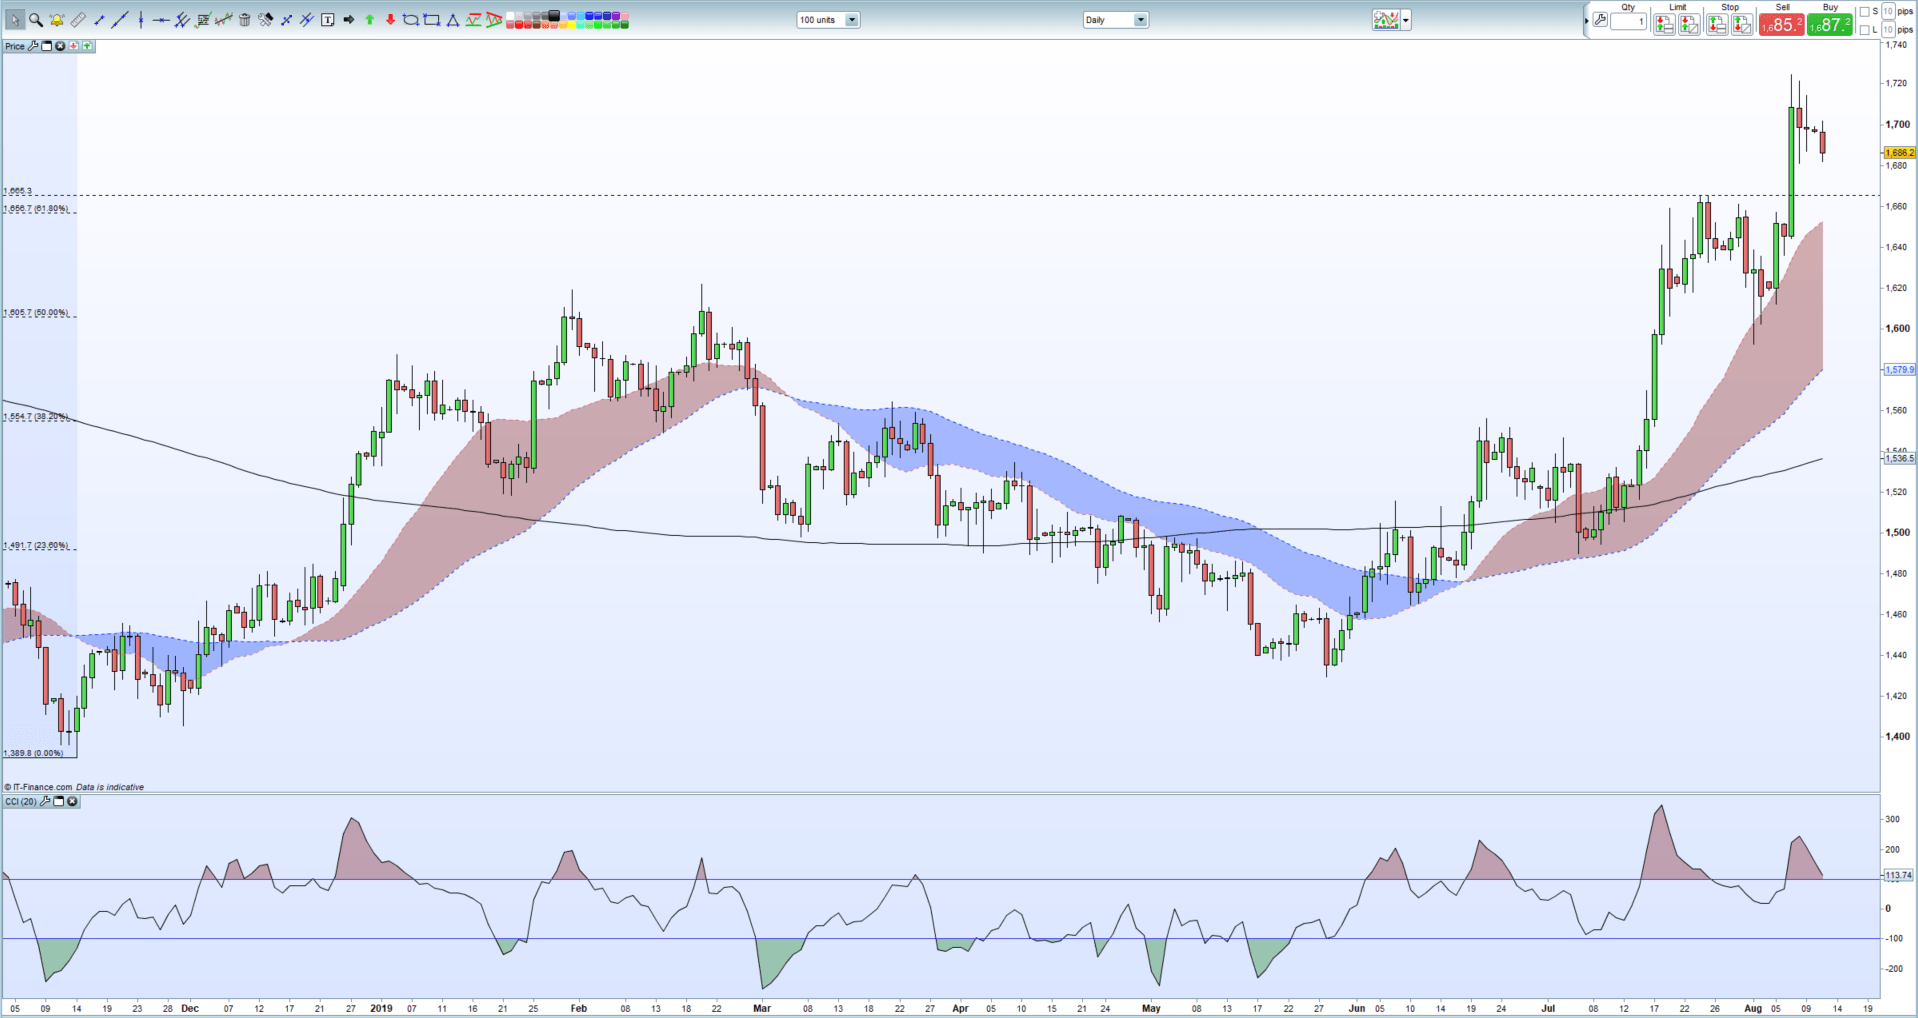
Silver’s recent breakout has stalled, and the recent slip back has pushed the price back towards an important support zone between an old double-high at $16.65/oz. and the 61.8% Fibonacci retracement level at $16.56/oz. Just below here is the 20-day moving average which again should provide a level of support. As with gold, the chart remains biased to further upside with the recent drift lower taking silver out of extreme overbought territory.
Silver Daily Price Chart (November – August 12, 2019)
How to Trade Silver: Top Trading Strategies
Traders may be interested in two of our trading guides – Traits of Successful Traders and Top Trading Lessons – while technical analysts are likely to be interested in our latest Elliott Wave Guide.
What is your view on Gold and Silver – bullish or bearish?? You can let us know via the form at the end of this piece or you can contact the author at nicholas.cawley@ig.com or via Twitter @nickcawley1.


