


Nasdaq 100 Outlook:
- Tech stocks were initially hit by news that the US would not deal with Huawei, but a later clarification revealed that special licensing processes are still in place
- Unlike the Dow Jones and S&P 500, the Nasdaq did not breach its ascending trendline from late December
- Interested in equities? Check out the DailyFX Podcast with Andrew Milligan, head of global strategy at Aberdeen Standard Investments
Nasdaq 100 Forecast: Index Stalls at Resistance Near July Lows
The Nasdaq 100 began Friday trading under pressure, but a clarification from the White House effectively neutralized the immediate threat to tech stocks. Consequently, most losses were erased as the Index went on to test resistance marked by prior highs in August and October of 2018. If the tech-heavy Index is to continue its climb higher next week, it will first have to drive through the area in which it is currently ensnared.
Nasdaq 100 Price Chart: Daily Time Frame (September 2018 – August 2019) (Chart 1)
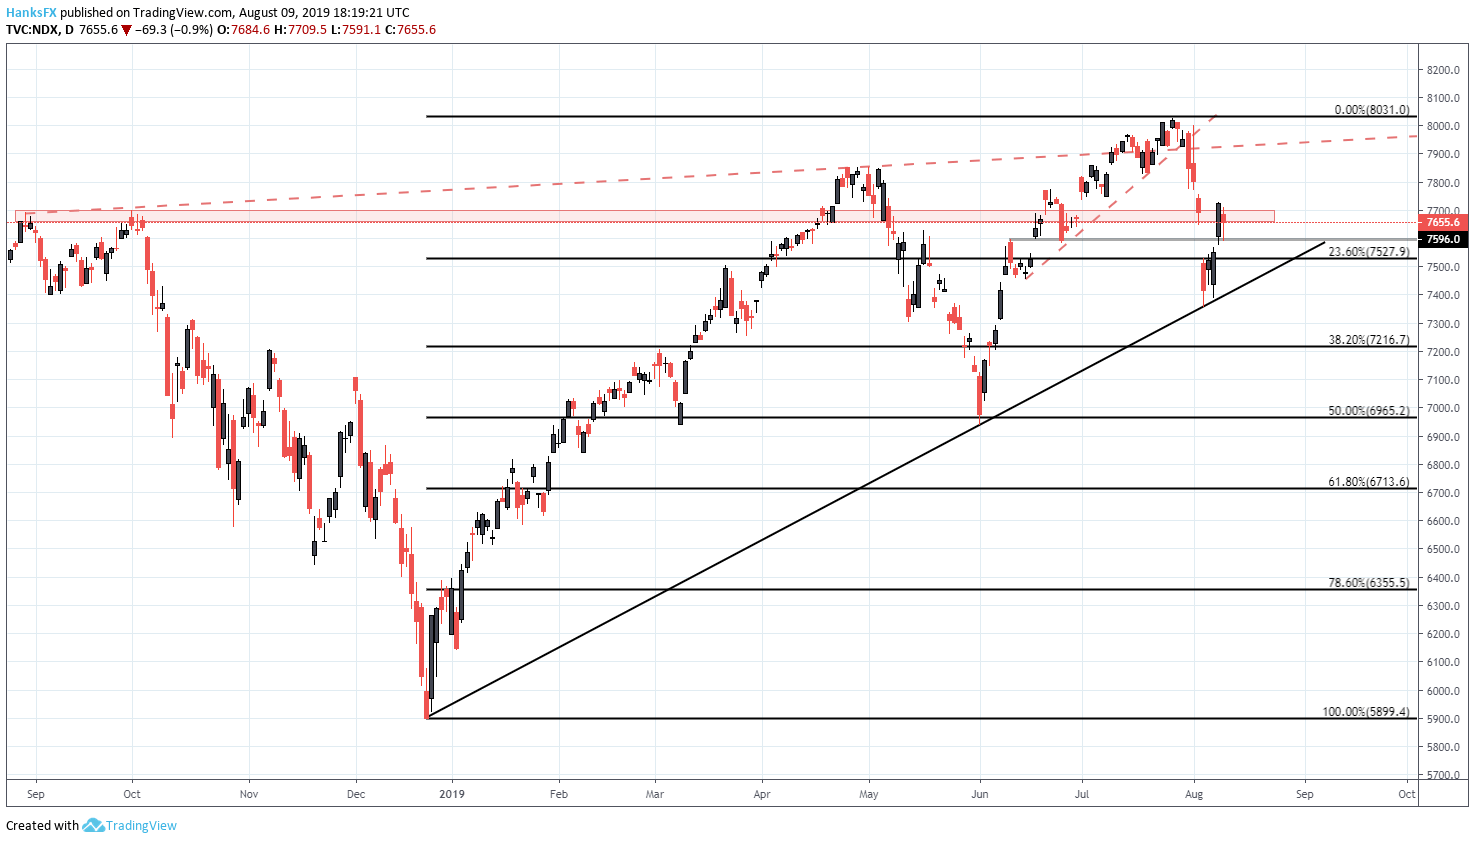
Chart created with TradingView
Secondary resistance will look to reside around the highs from April and May near 7,850. The peaks, combined with those from September 2018, work to form an ascending trendline that could mark a tertiary spot of resistance before all-time highs can be targeted. While the path higher is littered with barriers, hopes of another Fed rate cut have seemingly won out over the fear derived from an escalated trade war. While the headwinds may weigh over the longer-term and eventually drive equities lower, calling a top at this point might be an act of futility. When selling does resume however, the NDX will look to enjoy a series of supportive levels.
Sign up for our Free Weekly Equity Webinar in which critical technical levels and fundamental themes are analyzed each week.
Trading near 7,670 at the time of this article’s publication, the Nasdaq 100 has three notable support levels in close proximity. First is marked by the high on June 11 at 7,596 which is somewhat insignificant for the grander scheme of the Index, but has influenced price multiple times since the level’s inception. Second is the 23.6% Fib retracement around 7,527.
Nasdaq 100 Price Chart: 1 – Hour Time Frame (June – August) (Chart 2)
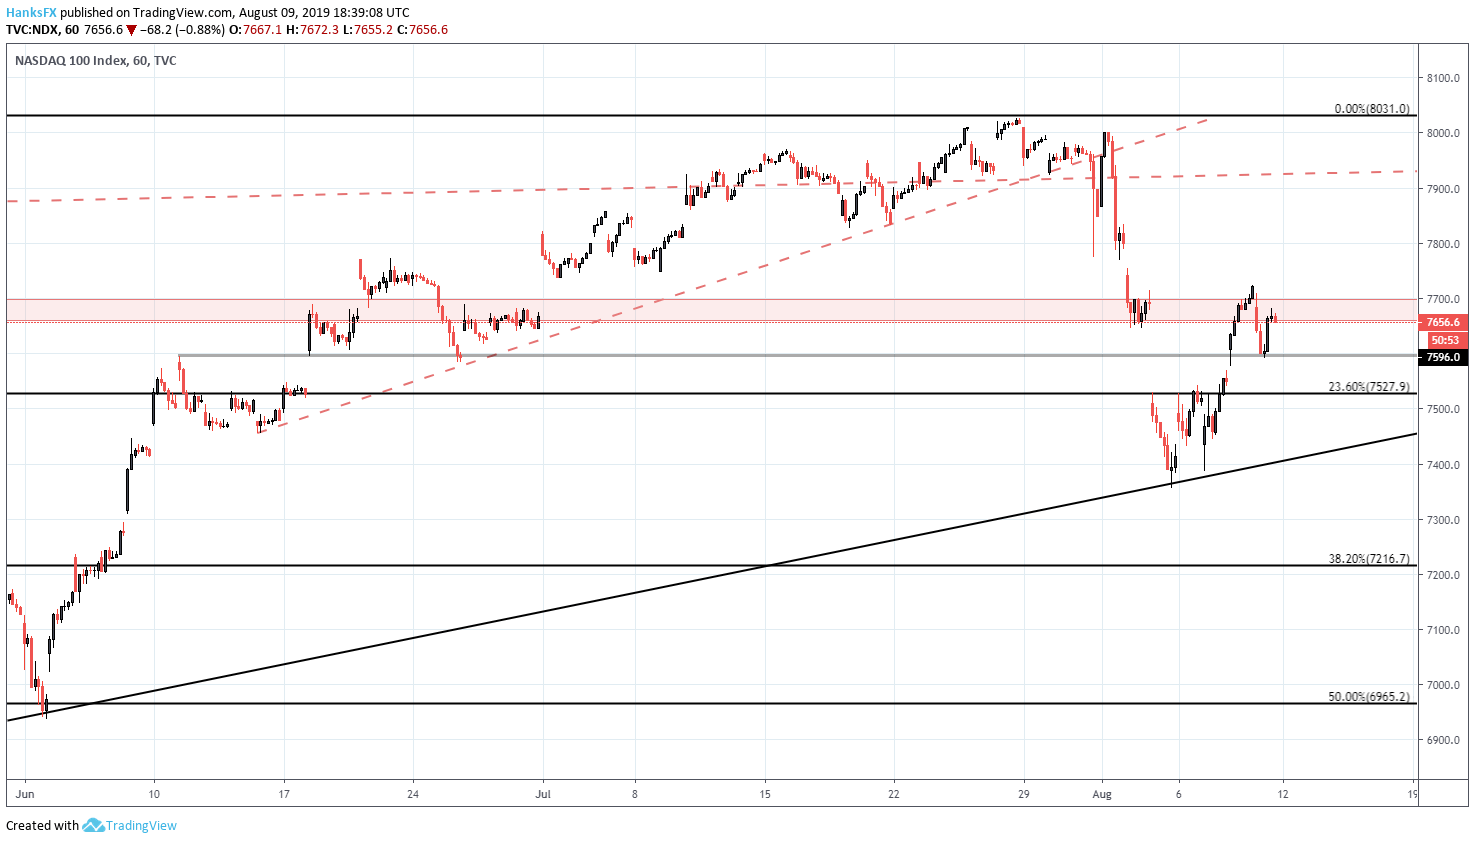
Chart created with TradingView
Finally, and perhaps most importantly, is the ascending trendline from late December. While the Dow Jones and S&P 500 have both slipped beneath their respective trendlines originating from Christmas Eve, the Nasdaq has stayed afloat. If bearishness resumes, this level could play a pivotal role in stalling an extension downward. Fore more technical analysis and fundamental updates on the major equity markets, follow @PeterHanksFX on Twitter.
--Written by Peter Hanks, Junior Analyst for DailyFX.com
Contact and follow Peter on Twitter @PeterHanksFX
Read more: Dow Jones, Nasdaq 100, S&P 500 Forecast: ETF Flows Hint at Bearishness


