

EURGBP Price, Chart and Analysis:
- EURGBP rally re-starts after weeks of small gains.
- EURGBP is overbought but nears a fresh one-year high.
Q3 2019 EUR and GBP Forecasts andTop Trading Opportunities
Keep up to date with all key economic data and event releases via the DailyFX Economic Calendar
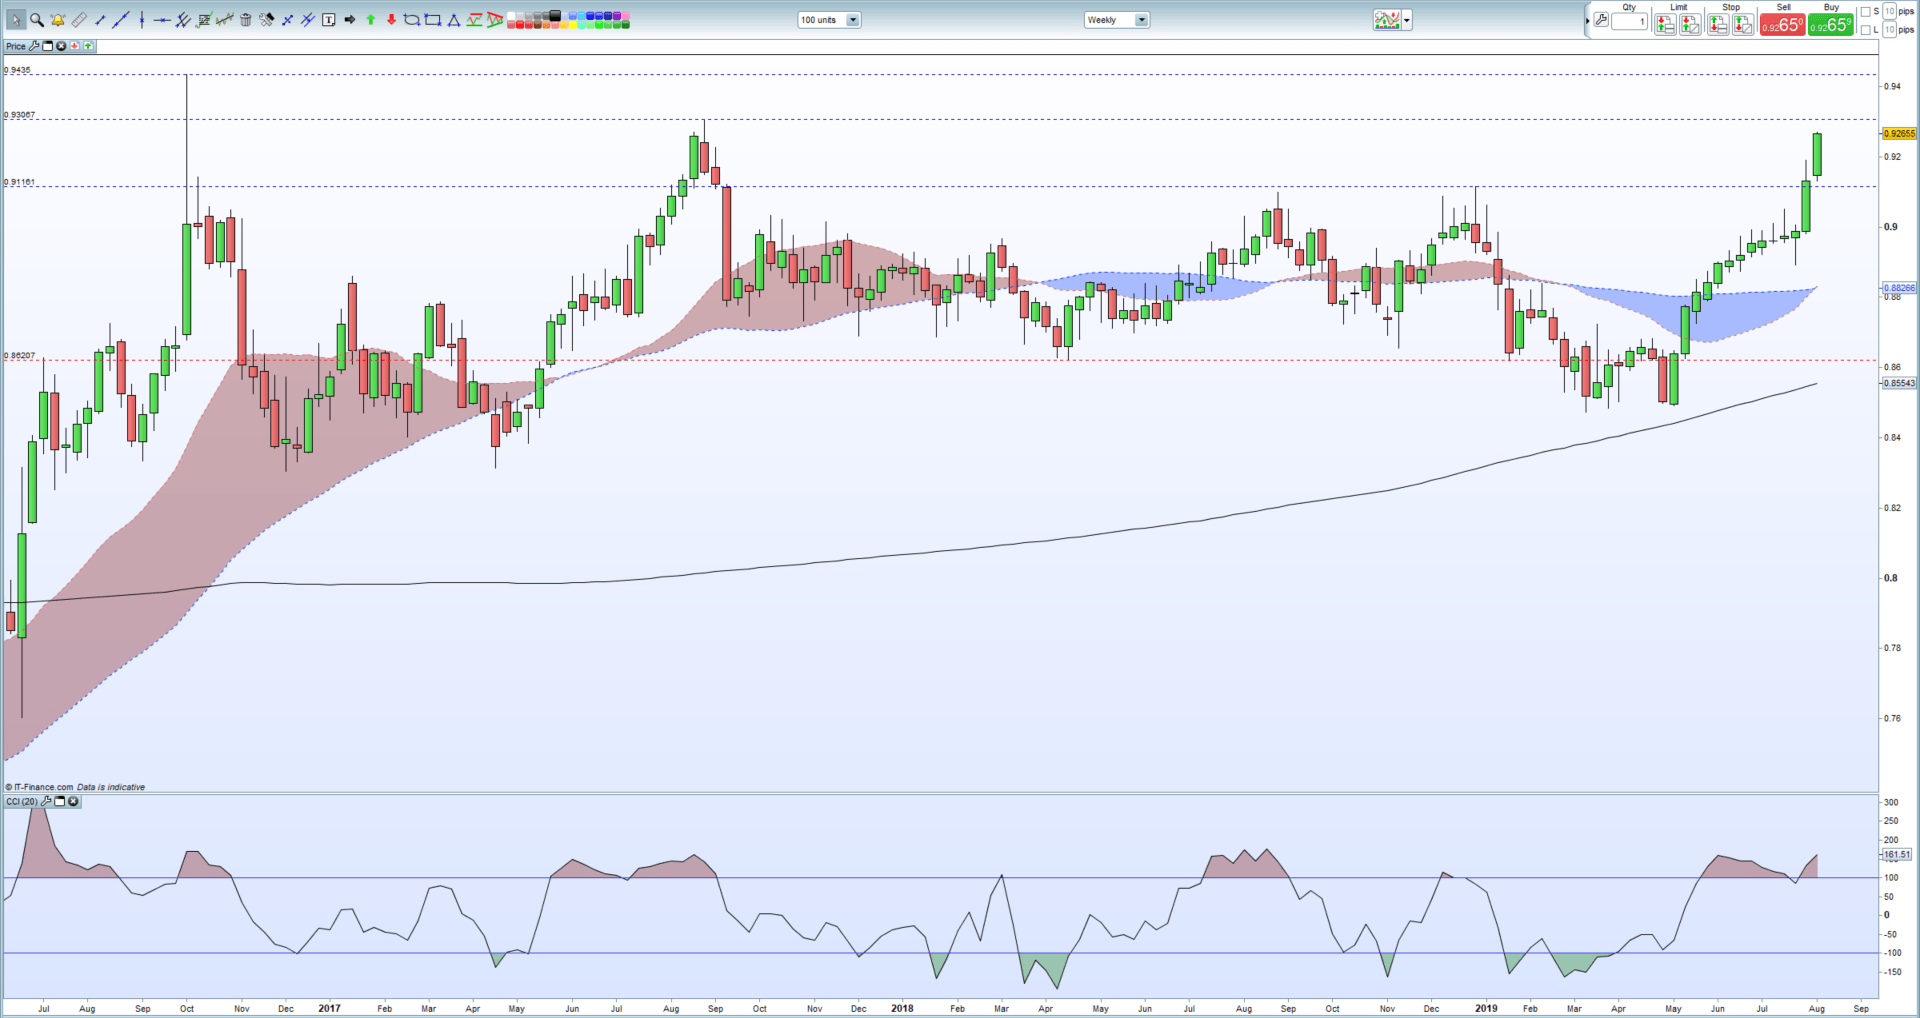
EURGBP is now nearing its highest level in over three-months and may make an attempt on the October 2016 post-Brexit spike high but warning signals are flashing. The recent rally has gathered strong momentum in the past two-weeks, after a period of gentle upside movement, pushing the CCI indicator into overbought territory on the weekly chart. While neither currency can be described as strong, the ongoing Brexit standoff between the UK and the EU is making itself felt more on the British Pound as the clock ticks down to October 31. Both sides have said that they would like to strike a deal, but the EU says the current Withdrawal Agreement is final and will not be changed, while the UK says it must be changed if a deal is to be reached.
What is the Brexit Backstop and How Does it Impact the Pound?
The weekly EURGBP shows the recent strong move higher but may stall as we reach the August 2017 high at 0.9307. If this level is broken and closed above then the pair may make an attempt at 0.9435, back to levels seen just weeks after the UK voted to leave the EU. To the downside, 0.9130 - 0.9116 may stall any sell-off in the short-term, but the chart will still show an upside bias if this level holds firm. Client sentiment – see below – remains bullish.
EURGBP Weekly Price Chart (July 2016 – August 9, 2019)
IG Client Sentiment data shows traders are 17.6% net-long EURGBP, a bullish contrarian bias. Traders are further net-short than yesterday and last week and the combination of current sentiment and recent changes give us a stronger EURGBP bullish contrarian bias.
Traders may be interested in two of our trading guides – Traits of Successful Traders and Top Trading Lessons – while technical analysts are likely to be interested in our latest Elliott Wave Guide.
What is your view on EURGBP – bullish or bearish? You can let us know via the form at the end of this piece or you can contact the author at nicholas.cawley@ig.com or via Twitter @nickcawley1.