


GOLD PRICE OUTLOOK – SUMMARY POINTS
- Spot gold prices soared over 14% since June as interest rates collapse in response to US China trade war risks and central banks easing monetary policy
- XAUUSD appears a bit overextended and possibly due for a healthy pullback before pushing higher again
- Check out the free DailyFX Q3 Gold Forecast for in-depth fundamental and technical outlook
Gold recorded an aggressive move to the upside recently with the precious metal getting a boost from safe-haven demand spurred by heightened trade war tension between the US and China. The ongoing trade spat between the world’s two largest economies has largely motivated the Federal Reserve and other central banks to cut interest rates hoping to offset economic headwinds from rising market uncertainties.
Take a look at these Top Gold Trading Strategies
Spot gold has benefited tremendously from these developments with the commodity running up to multi-year highs. In fact, XAUUSD is now trading around $1,470 which is its highest level since May 2013. While the overarching uptrend is expected to continue, gold prices could be at risk for a modest pullback from its impressive rally.
GOLD PRICE CHART & GOLD VOLATILITY (GVZ): DAILY TIME FRAME (JANUARY 2019 TO AUGUST 2019)
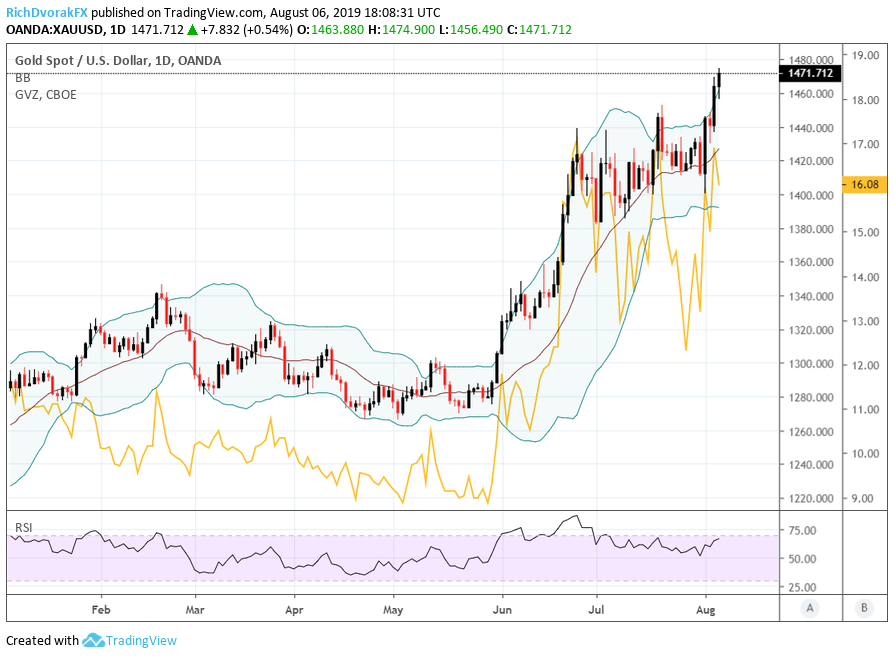
Chart created using TradingView
After breaking out above the $1,435 price zone – a potential area of technical resistance posed by gold’s August 2013 swing high – XAUUSD is now trading more than 2-standard deviations away from its 20-day simple moving average. Naturally, a degree of selling pressure might be expected here as commodity traders long gold lock in profits.
Additionally, weakness in spot gold prices over the short-term could stem from the return of risk appetite as markets digest the latest US China trade war developments. This is hinted at by the small pullback in GVZ – Cboe’s gold price volatility index.
GOLD PRICE CHART & INVERTED US10YR TREASURY YIELD (TNX): DAILY TIME FRAME (DECEMBER 2018 TO AUGUST 2019)
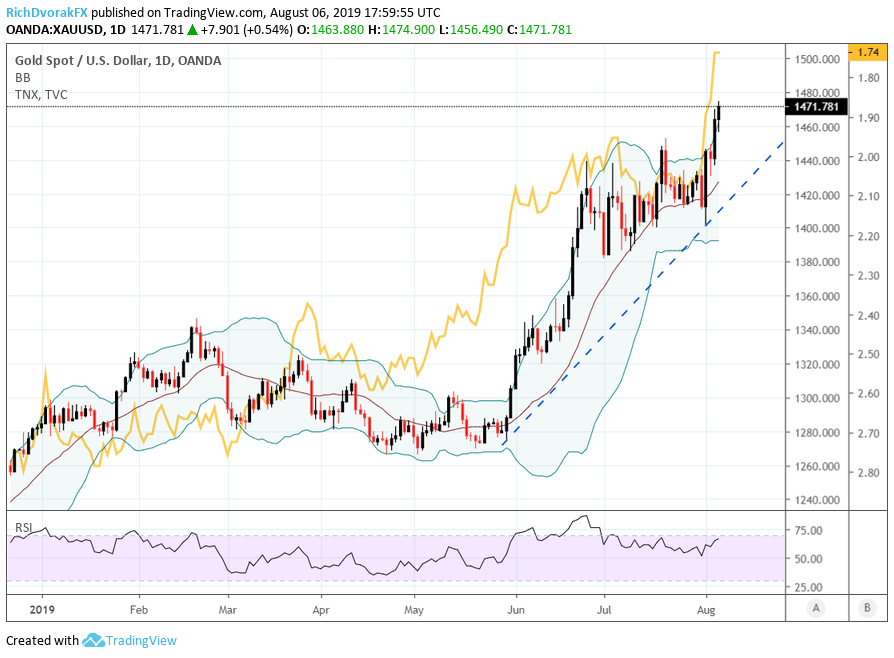
Chart created using TradingView
Nevertheless, XAUUSD certainly has potential to continue ripping higher. Now that the Federal Reserve has confirmed its willingness to ease monetary policy at its July FOMC meeting, additional moves by the Fed to provide more accommodative policy seems increasingly likely – particularly in light of damaged risk appetite and heightened trade war uncertainty. Traders are now pricing in a 100% probability of a September rate cut with roughly 75 basis points of cuts to the Fed’s benchmark rate from the current 2.00-2.25% range by year-end according to overnight swaps.
Yet, the sharp slide in the US10YR Treasury yield (TNX) so far this year has outpaced the steep climb in spot gold prices. With the expectation that interest rates will remain under pressure driven by lingering trade war uncertainty and subdued risk appetite, the possibility of sustained downward pressure on the US10YR Treasury yield remains a compelling prospect for gold bulls.
-- Written by Rich Dvorak, Junior Analyst for DailyFX.com
Connect with @RichDvorakFX on Twitter for real-time market insight


