


Nasdaq 100 Price Outlook:
- After President Trump announced a new round of tariffs on China, US stock markets sold off alongside other risk assets
- While the Nasdaq looks to close above Friday’s lows, the picture is bleak headed into next week
- Sign up for our Weekly Equity Outlook Webinar to gain earnings insight and stock market analysis through the lens of global macro trends.
Nasdaq 100 Price Outlook: Unfilled Gaps Threaten the Index's Rally
The Nasdaq 100 finds itself vulnerable heading into the first full week of August after President Trump unexpectedly escalated the trade war with China. The subsequent market reaction sent the tech-heavy Index into the red, driving it beneath two technical levels and denting sentiment. Should fundamental themes remain constant over the weekend – which is unlikely if history is any indication – the Nasdaq will still find itself threatened as it flounders for support.
Nasdaq 100 Price Chart: Daily Time Frame (Chart 1)
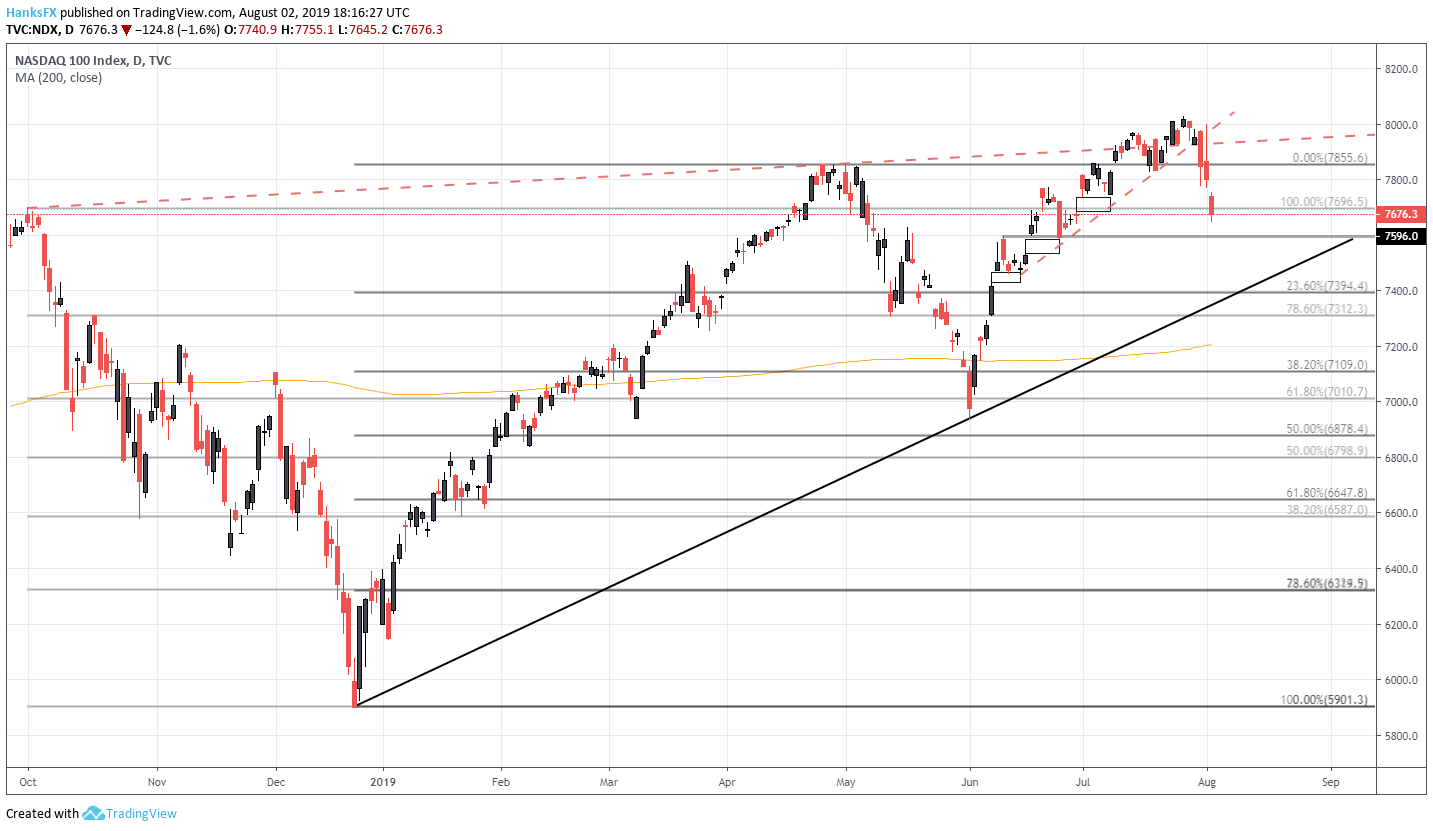
Over the longer-term, the Nasdaq 100 finds itself comfortably above an ascending trendline from late December. A similar trendline can be observed on the Dow Jones, S&P 500 and even the DAX 30 which recently broke beneath the level. While the Nasdaq enjoys a sizable cushion before the trend is threatened, few levels of buoyance separate the two. In fact, the distance between the current trading price and the longer-term bullish trend is plagued with a series of unfilled gaps. One gap was filled in Friday trading, but two remain.
Nasdaq 100 Price Chart: 1 – Hour Time Frame (Chart 2)

The gaps in question are visible on the hourly chart shown above. With the potential for accelerated declines if support is breached, the past price action of the Nasdaq 100 has placed significant reliance on the 7,600 area. 7,600 is marked by the swing high in early June and as the ceiling of the next gap beneath the Index. Conveniently, it is also where the 200-day moving average resides.
Unfamiliar with past trade wars? Check out our guide, A Brief History of Trade Wars.
The confluence of support should offer a firm barrier to further declines, but if the fundamental landscape deteriorates over the weekend, a break below the zone could open the door to further losses. A decline beyond the 200-day moving average could quickly see the Nasdaq move to threaten the ascending trendline from late December. With that in mind, keep up to date with the fundamental and technical themes to watch with live updates on Twitter @PeterHanksFX.
--Written by Peter Hanks, Junior Analyst for DailyFX.com
Contact and follow Peter on Twitter @PeterHanksFX
Read more: Fed Rate Decision Prompts Stock Traders to Flee Bank & HYG ETFs


