


Bitcoin Price Forecast:
- Bitcoin is up 153% in the year-to-date, but recent price action suggests the crypto’s bullish trend is threatened
- To that end, an ascending trendline from mid-May could mark the line in the sand for medium-term BTCUSD price
- Interested in cryptocurrency? Check out our Bitcoin Predictions & Facebook Libra Podcast with Tone Vays
Bitcoin Price Chart is Coiled like a Spring, will it Bounce or Break?
After surging 260% in 2019 to nearly $14,000 last month, Bitcoin is taking a breather and threatening a critical tailwind to its continuation higher. The ascending trendline from mid-May provided support in June and has done so again in late July. A series of recent tests have probed the line, but bulls appear unwilling to surrender at this time. That said, hourly stochastic RSI is tiptoeing into overbought territory and could see bears pressure price back down to the level – which now enjoys confluence with a Fibonacci level at $9,545. If confluent support is unable to rebuke bears at this level, it is a worrisome sign for Bitcoin in the coming days.
Interested in longer-term trades? Check out our Third Quarter Forecast s for Gold, EURUSD and more.
Bitcoin Price Chart: 1 – Hour Time Frame (June – July) (Chart 1)

Chart created in TradingView
Over the longer-term however, stochastic RSI is wading in oversold territory as RSI continues to trend lower alongside price. Should the confluence of support keep Bitcoin afloat and allow bulls to retake control, resistance may reside at the 50% retracement level around $11,525 and around $12,000 marked by the descending trendline from June’s high. If price holds above support, BTC may work itself into somewhat of a wedge marked by the converging trendlines.
Bitcoin Price Chart: Daily Time Frame (May – July) (Chart 2)
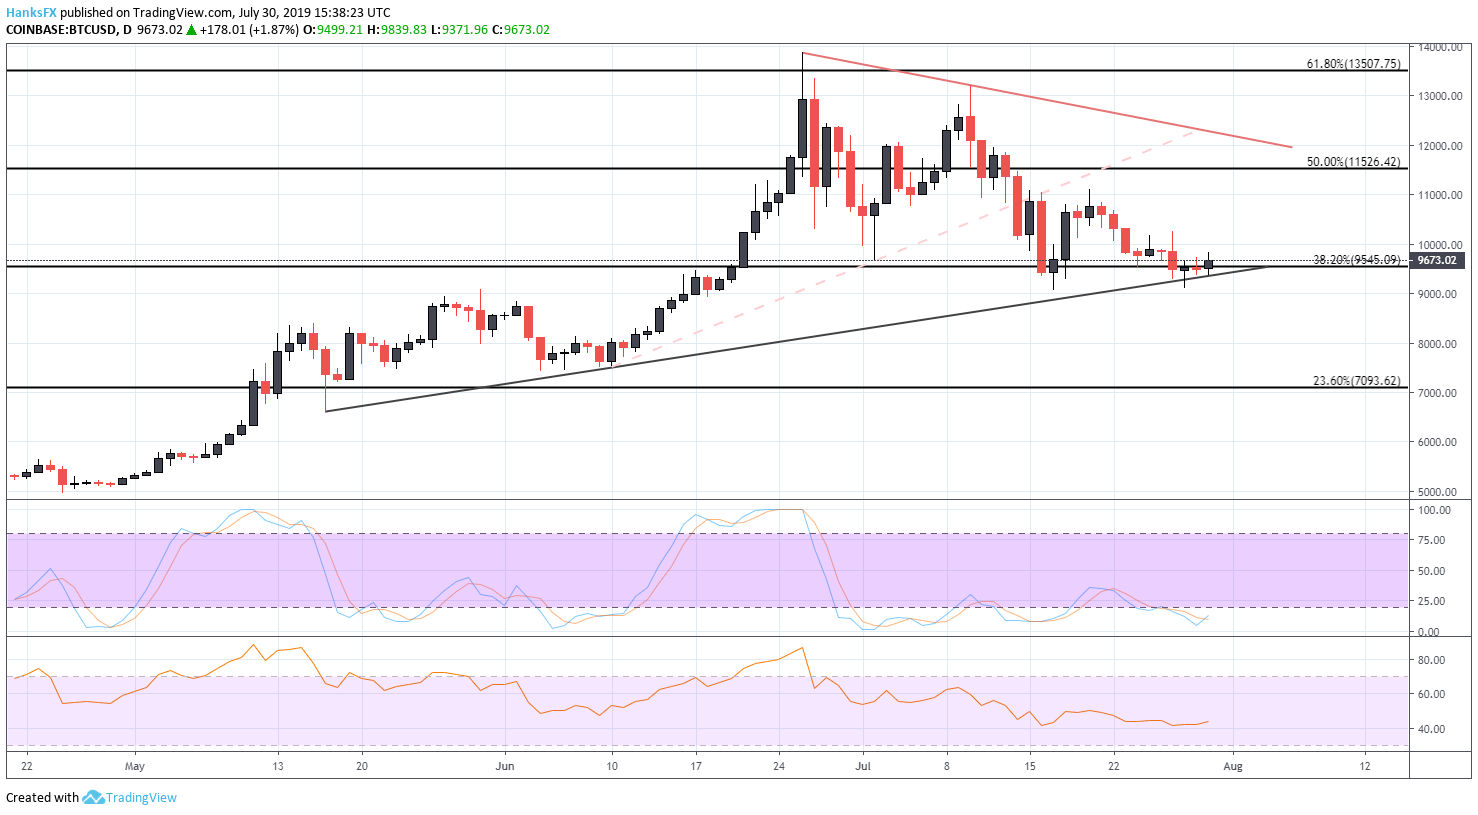
Chart created in TradingView
If, on the other hand, Bitcoin bulls are unable to hold above $9,545, a break beneath could quickly accelerate into a larger move as bullish bets unfold and the overarching trend higher is called into question. In this circumstance, initial support would look to reside around $7,093 – marked by the 23.6% Fib level. Further, Bitcoin volatility has been relatively muted as the cryptocurrency slowly bleeds to support but a failure at this level would likely spark volatility as traders look to reposition amid the new technical landscape.
--Written by Peter Hanks, Junior Analyst for DailyFX.com
Contact and follow Peter on Twitter @PeterHanksFX
Read more: Stock Market Outlook: Top 3 Themes to Watch in AAPL Earnings


