


Nasdaq 100 Price:
- A day after Facebook (FB) beat expectations, two other FAANG members will report and take up the torch for the technology sector
- AMZN and GOOG are the world’s third and fourth largest publicly traded companies, affording them significant weight on the Nasdaq 100 and S&P 500 indices
- Interested in earnings season? Learn about the key facts and why it is important to the stock market
AMZN, GOOG Earnings to Drive Nasdaq 100 Price, Tech Stocks
The Nasdaq 100 will look to take its cues from Amazon and Google headed into Friday and the weekend as the two behemoth tech companies report earnings after the close on Thursday. Thus far, just over 25% of the S&P 500 has reported earnings for the second quarter and the percentage of companies that have beat expectations stands at 78%.
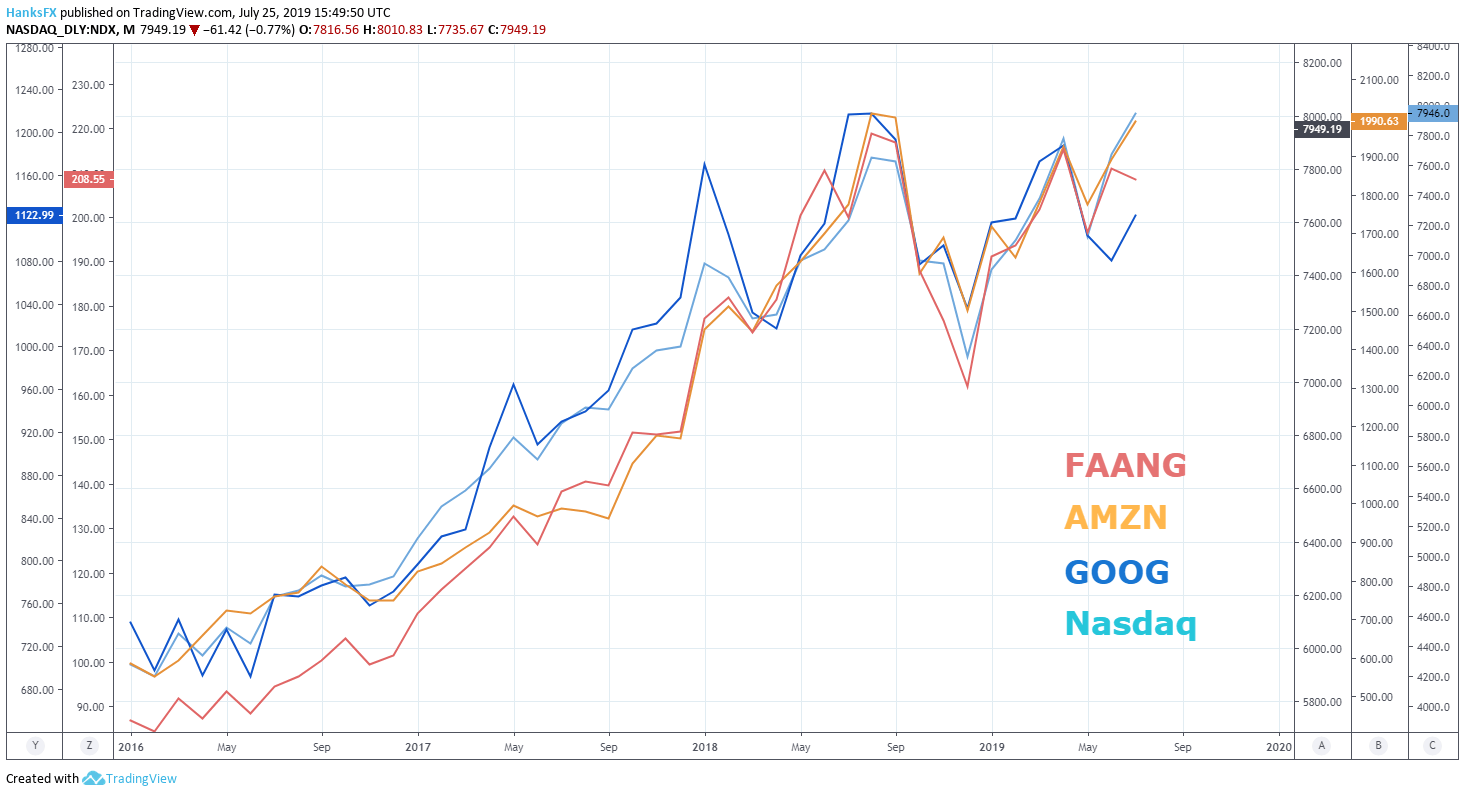
While the figure seems significant on the surface, its gravity is somewhat reduced when compared to the one-year and five-year averages that stand at 76% and 72% respectively. That said, the high-flying FAANG group – often looked to as a gauge of the overall tech sector – is split down the middle thus far. Facebook (FB) boasted a stronger quarter with their results on Wednesday, whereas Netflix (NFLX) shares plummeted following a significant miss last week. Robust earnings from AMZN or GOOG could help to extend FAANG’s strength into the third quarter.
Earnings to Watch
Amazon & Consumer Spending
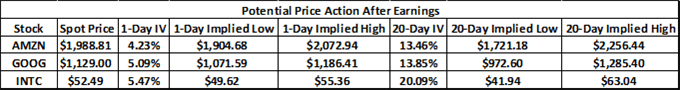
To that end, Amazon shares are expected to maintain a price range between $1,904 and $2,072. The topside of the range includes the all-time high for AMZN shares – around $2,050 – tagged in September 2018. Minor support will look to reside around $1,964 as it marks the stock’s swing high in May and has provided buoyancy in July.
Amazon (AMZN) Stock Price Chart: Daily Time Frame (January – July) (Chart 1)
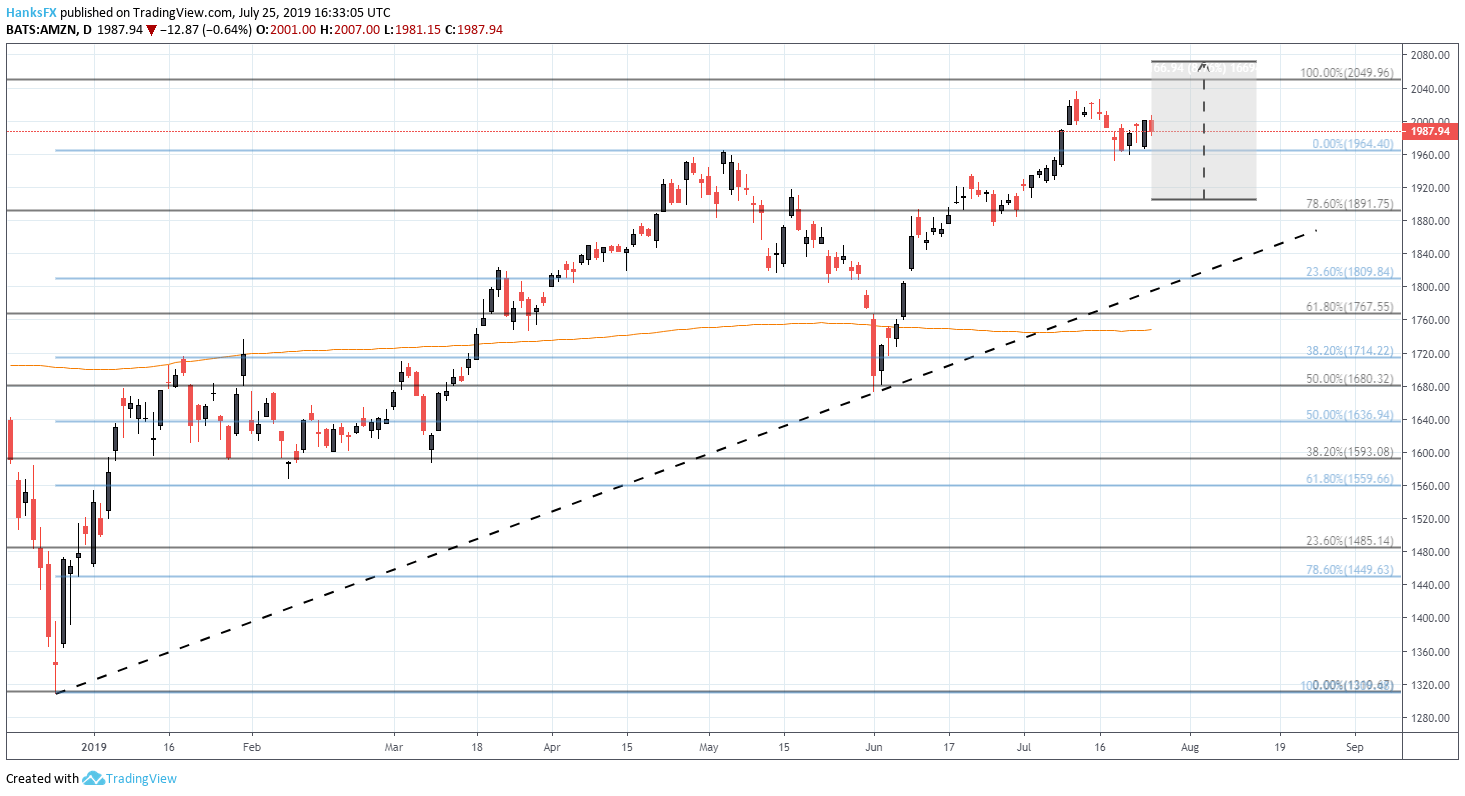
Apart from AMZN price action, and perhaps more importantly, Amazon earnings will offer insight on the state of consumer spending in the United States. As the Fed looks to cut rates at its meeting next week, market participants will gravitate toward any data that could muddy the case for further monetary policy easing. Should Amazon report strong figures and an encouraging outlook, the stronger than expected retail sales from last week could be further vindicated and add to the case for a potential rebound in domestic growth.
Third Quarter Forecasts are here! Check out the outlook for equities, gold, the US Dollar and more.
Google and the US-China Trade War
Similarly, Google may provide information on broader themes outside earnings season. The search-engine provider has been one of a few companies that has been allowed to continue operations with Huawei. This workaround may positively impact their quarter two results like it did with Micron (MU).
Google (GOOG) Stock Price Chart: Daily Time Frame (January – July) (Chart 2)
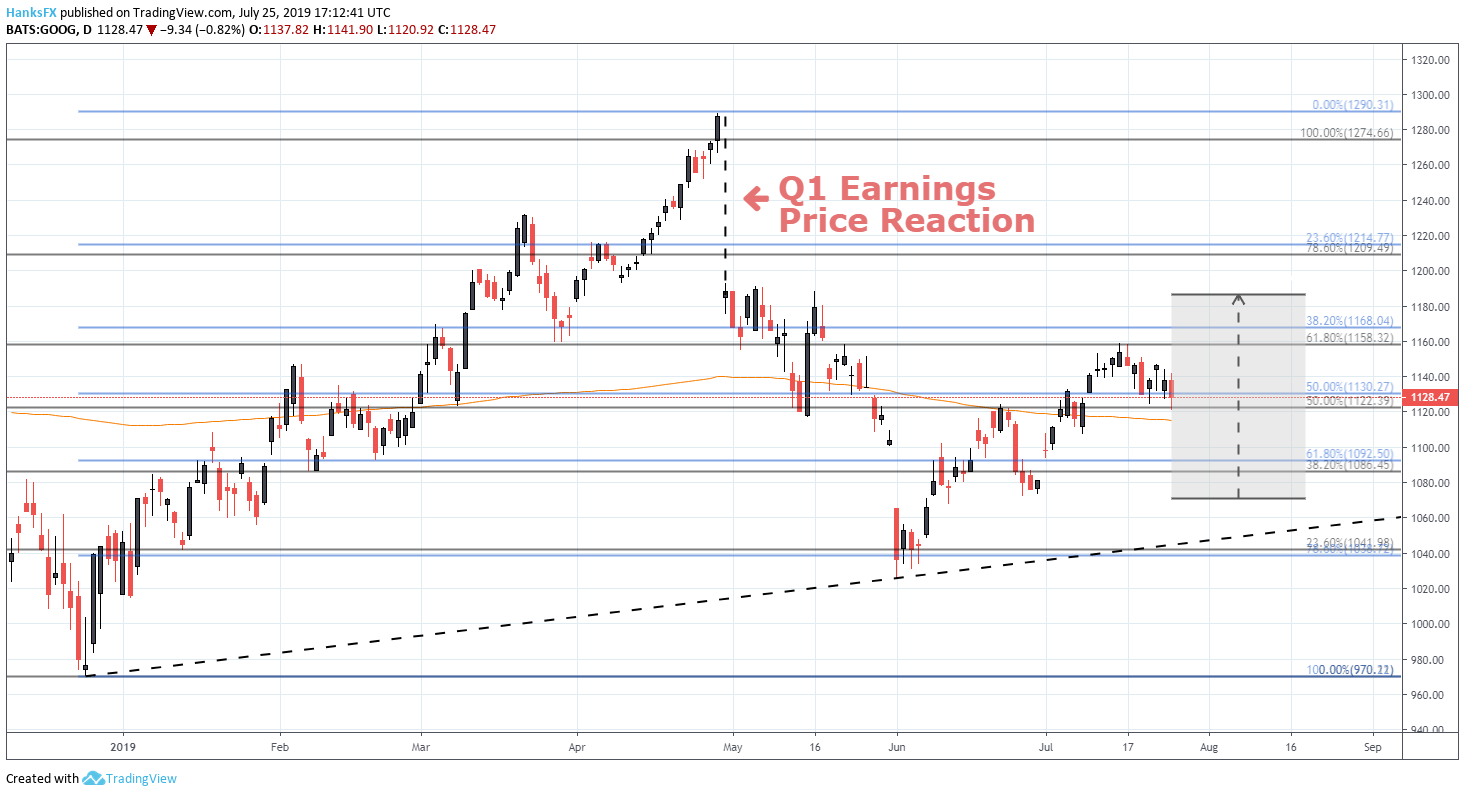
The stakes are high for Google shareholders after hours as the company’s first quarter results saw the stock plummet 10%. That said, earnings-implied volatility this quarter is significantly lower at just 5%. The resultant implied price range includes various technical levels with resistance around $1,158 and support slightly beneath $1,120 at the 200-day moving average.
Will Intel Remain a Laggard in the Semiconductor Space?
Finally, chip-maker Intel Corp (INTC) will report alongside AMZN and GOOG. The company has been a laggard in the semiconductor space, gaining just 10% in the year-to-date. Like Google, first quarter results from INTC were less than stellar and shares subsequently cratered 11% after hours. Should the company disappoint again Thursday, the bearish reaction could look to undo the lift provided to the Nasdaq 100 this week by the semiconductor sector on the back of strong earnings from Texas Instruments (TXN).
Intel (INTC) Stock Price Chart: Daily Time Frame (January – July) (Chart 3)
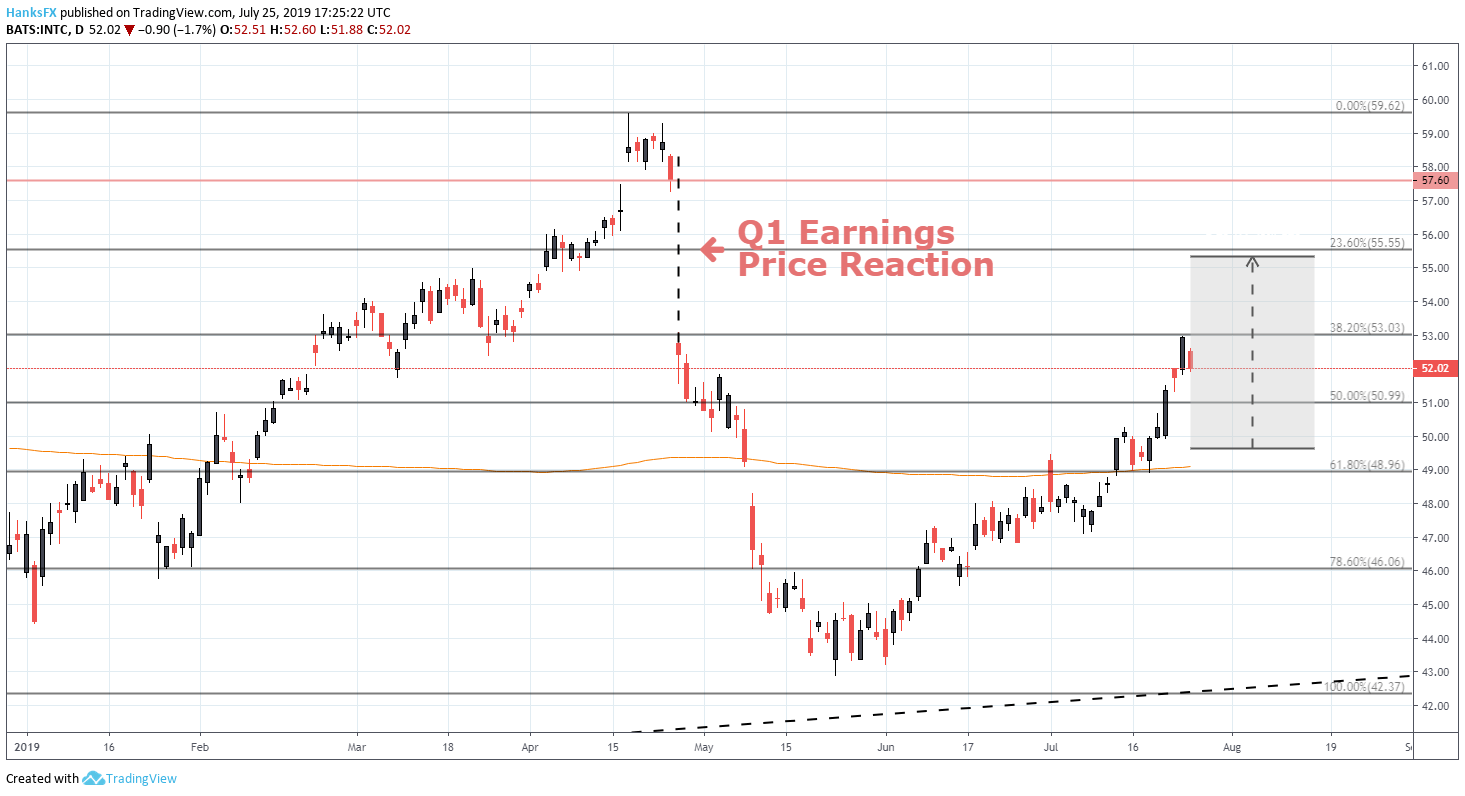
Given the volatility of the semiconductor sector, I am hesitant to wager that the nearby nearby Fibonacci levels carry sufficient technical merit to stall a significant price move, thus leaving the 200-day moving average around $49 with heightened importance. While the market awaits results from Amazon, Google and Intel, follow @PeterHanksFX on Twitter for updates and analysis on other scheduled reports.
--Written by Peter Hanks, Junior Analyst for DailyFX.com
Contact and follow Peter on Twitter @PeterHanksFX
Read more: Nasdaq 100 Outlook: FB, TSLA Earnings to Drive Stock Sentiment


