


Gold & Silver Price Analysis and Talking Points:
- Gold Prices Continue Pullback, Focus on Powell’s Testimony
- Silver Price Outlook | Bounce Off Psychological Support, Gold/Silver Ratio Easing
See our quarterly gold forecast to learn what will drive prices throughout Q3!
Gold Prices Continue Pullback, Focus on Powell’s Testimony
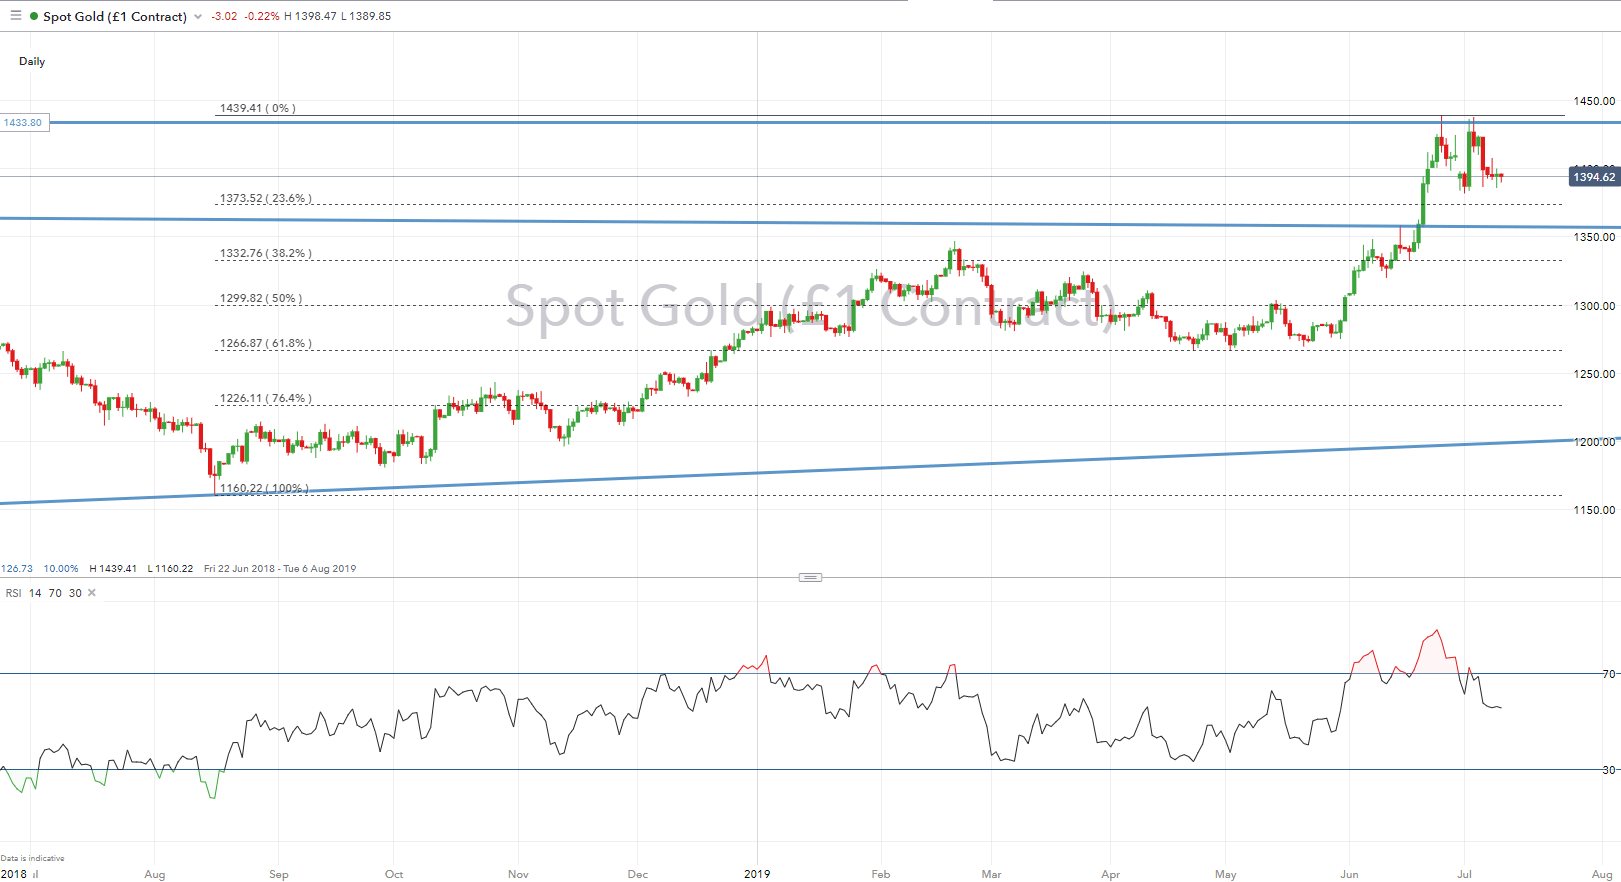
Following last week’s firm NFP report, gold prices have been on the back-foot, slipping below $1400 as both the USD and US yields have gained amid a re-pricing of Federal Reserve rate expectations, which has seen 50bps taken off the table. Consequently, gold prices are eyeing key support at the $1380 handle, while the 23.6% Fib resides at $1373. The next move in the near-term is likely to depend on Fed Chair Powell’s testimony as well as the FOMC minutes. Given that Fed officials have not dampened market expectations that the central bank will cut interest rates at the July meeting, this looks to be a done deal, however, the path going forward is a little less clear. Thus, a signal that there is unlikely to be a series of rate cuts as indicated by money markets, could provide support for the USD and US yields with gold sliding towards support.
Of note, the prepared speech from Fed Chair Powell is unlikely to make mention of monetary policy, however, it is most likely that the Chair will be asked on the outlook of monetary policy in the Q&A session with focus on when the first cut will take place and how much will the Fed lower rates.
GOLD Technical Levels
Resistance 1: $1400 (Psychological)
Resistance 2: $1435-40 (Double-Top)
Support 1: $1380 (July low)
Support 2: $1373 (23.6% Fib)
GOLD PRICE CHART: Daily Time-Frame (Jun 2018 -Jul 2019)
What You Need to Know About the Gold Market
Silver Price Outlook | Bounce Off Psychological Support, Gold/Silver Ratio Easing
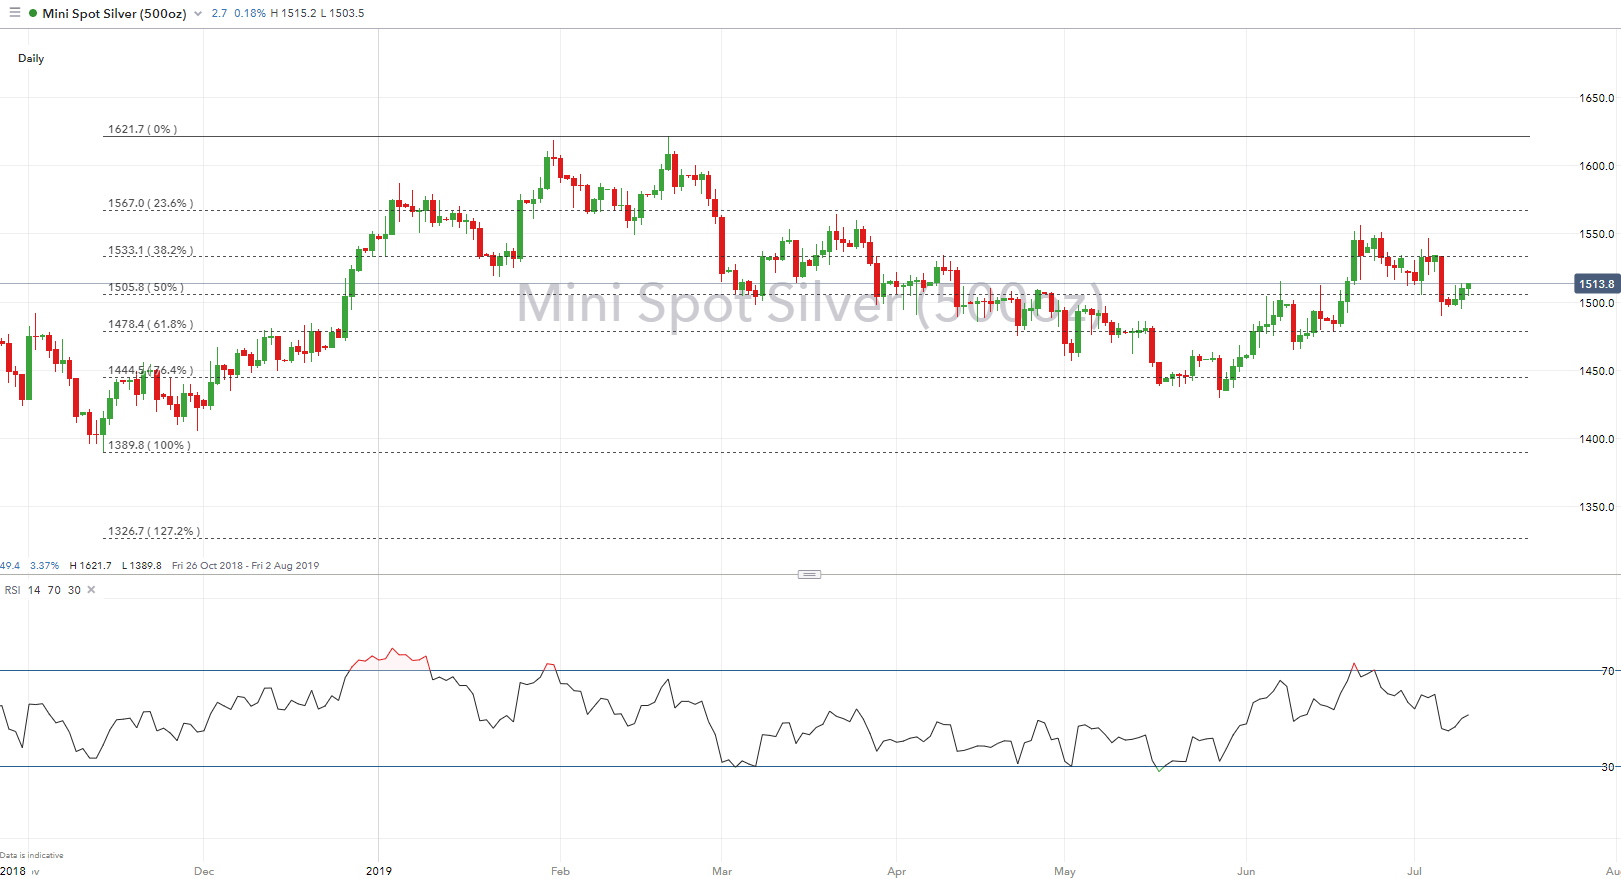
Last week we highlighted that there was potential room for silver to outperform given that the near 30yr peak in the gold/silver ratio makes the latter more attractive. While gold prices have edged below $1400, silver has managed to bounce off psychological support at $15.00, which in turn has seen the gold/silver ratio pullback back from 93.49 to 92.32. Topside resistance is situated at $15.33 (38.2%), whereby a break above exposes a move towards $15.50.
Silver Price Chart: Daily Timeframe (Oct 2018 – Jul 2019)
GOLD TRADING RESOURCES:
- See our quarterly gold forecast to learn what will drive prices through mid-year!
- Just getting started? See our beginners’ guide for FX traders
- Having trouble with your strategy? Here’s the #1 mistake that traders make
--- Written by Justin McQueen, Market Analyst
To contact Justin, email him at Justin.mcqueen@ig.com
Follow Justin on Twitter @JMcQueenFX


