


USD Price Analysis and Talking Points:
- GBPUSD | Flash Crash Trendline Breaks, Risks of Further Losses
- USDJPY | Record High US Equities Push USDJPY Higher
- USDCAD | Hovering Around 2019 Lows
See our quarterly USD forecast to learn what will drive prices throughout Q3!
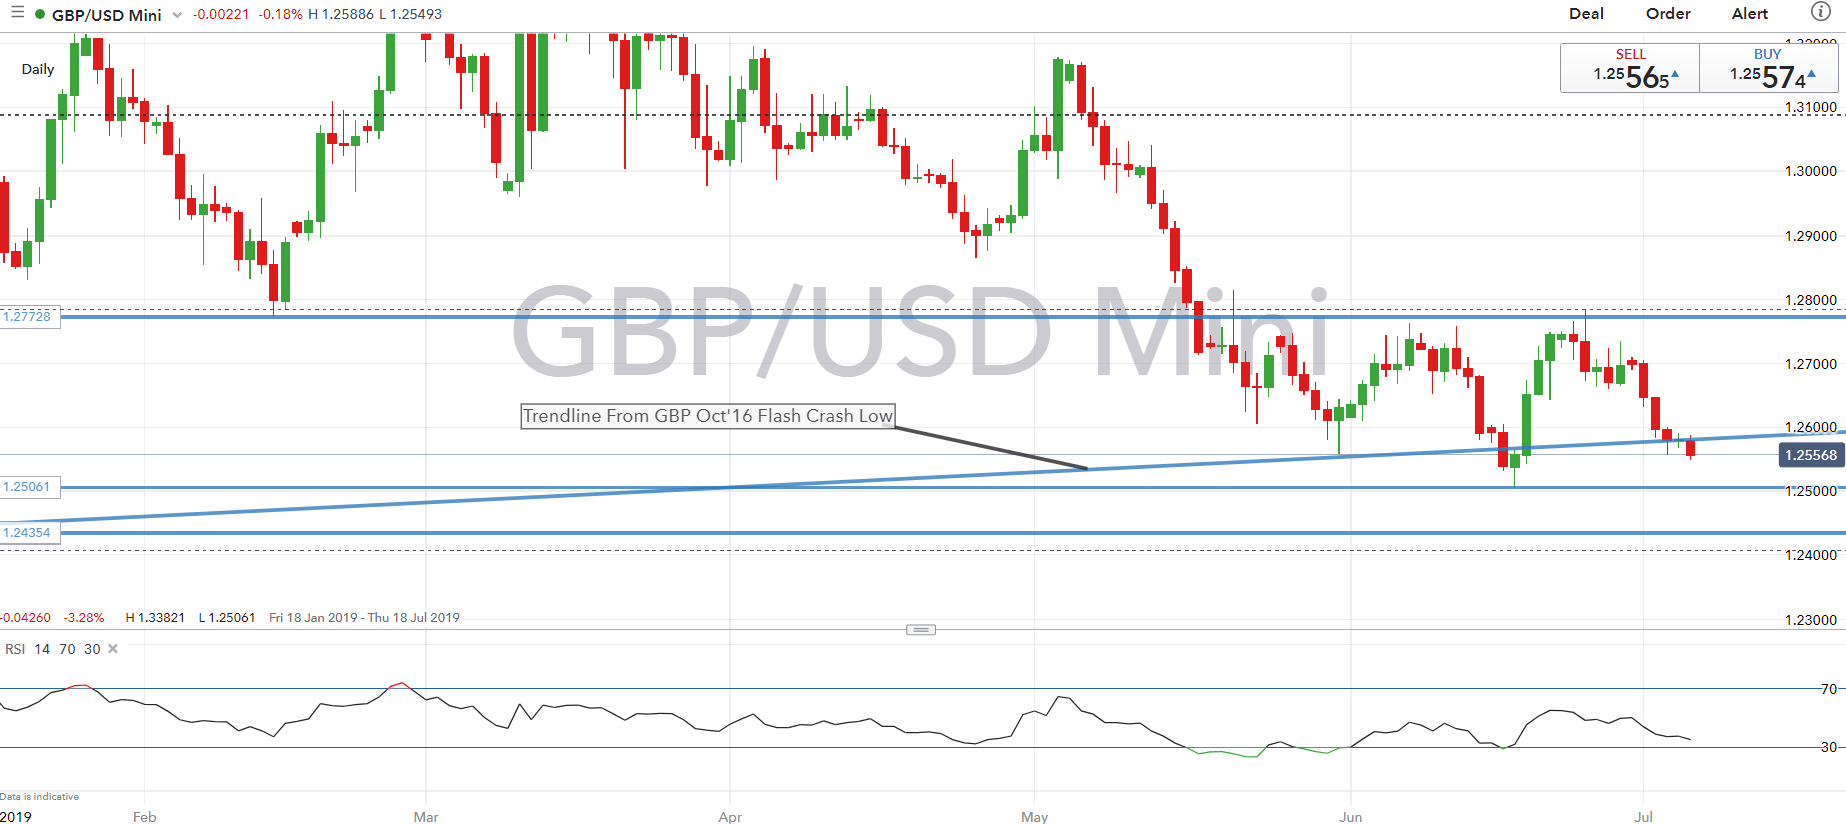
GBPUSD | Flash Crash Trendline Breaks, Risks of Further Losses
The outlook for the Pound continues to remain fragile with the currency trading on the defensive against its major counterparts. This week has seen sentiment in the currency deteriorate further as UK data continued to show that the UK economy is softening, while cautious comments from BoE Governor Carney has also seen bets that the central bank eases monetary policy sharply increase with a 25bps rate cut 60% priced in by the year end. The technical outlook for the Pound also remains soft having broken below the trendline from the flash crash low, consequently this has raised scope for a test of the June low at 1.2506 with further support situated at 1.2435 (YTD low). On the topside, resistance rests at the 1.26 handle.
GBPUSD PRICE CHART: Daily Time Frame (Jan 19 – Jul 19)
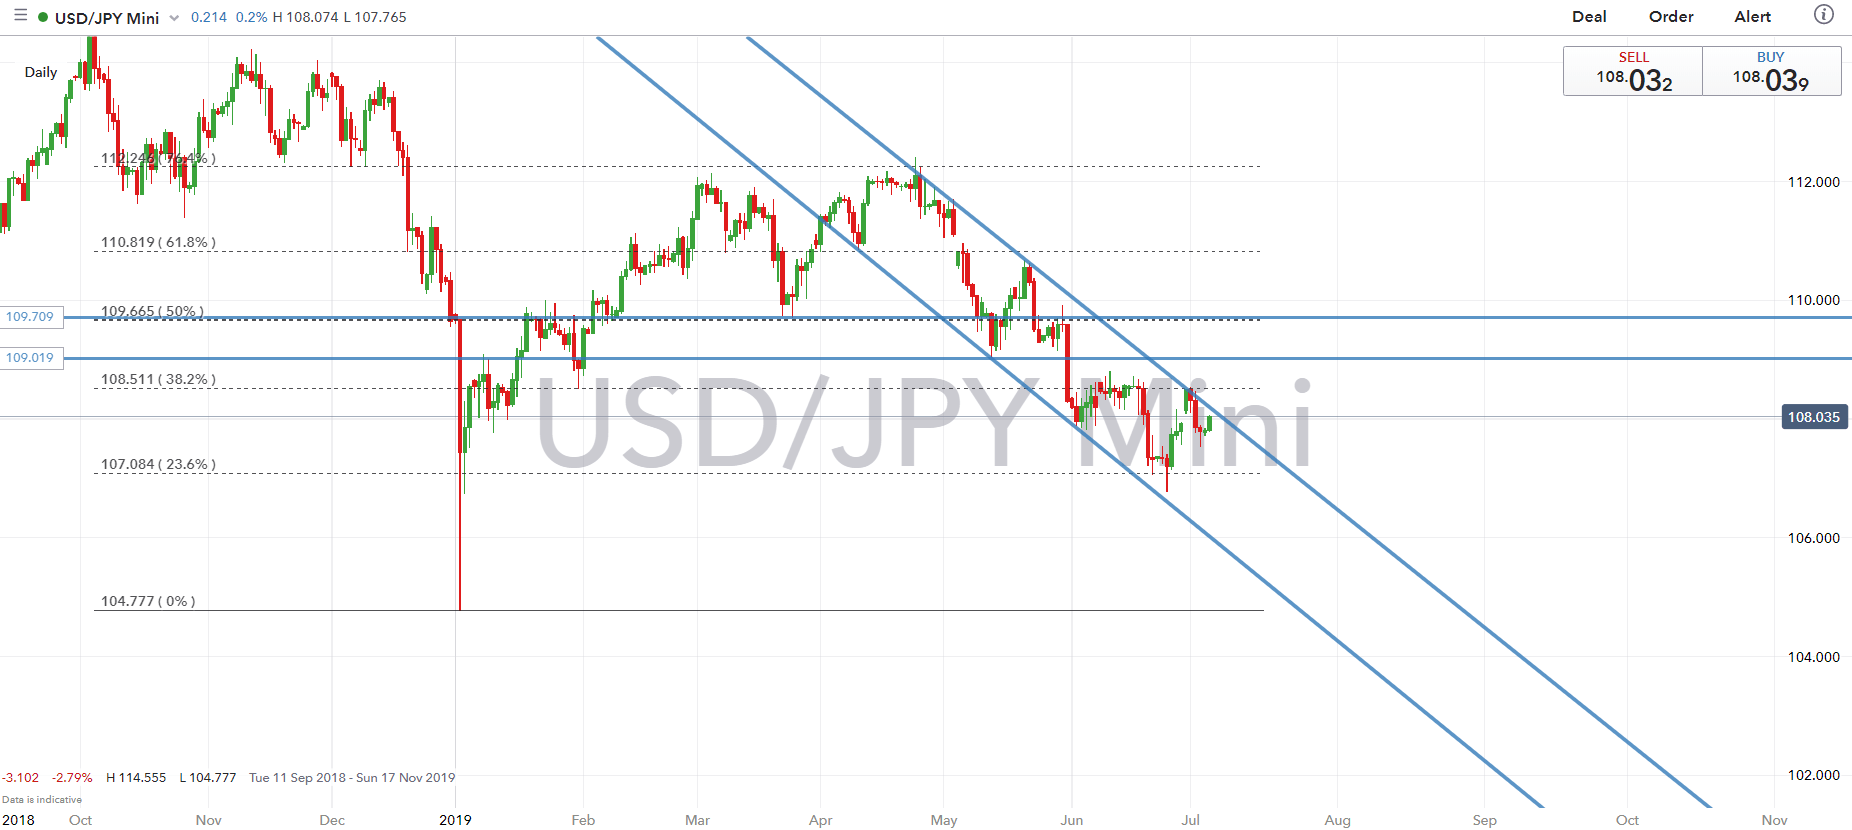
USDJPY | Record High US Equities Push USDJPY Higher
As equity market volatility continues to edge lower, equity markets have continued to grind higher with the S&P 500 posting a fresh record high on a move through 3000. As such, in this environment, the Japanese Yen has pulled from its recent advances against its major counterparts with USDJPY now hovering around the 108.00. Although, with the economic outlook seemingly slowing down, the bounce in the pair could be somewhat temporary, thus a rebound towards 108.50-109.00 may offer a potential to fade.
On the technical front, the pair has remained within its descending channel, however a break above could see key resistance tested at 108.50, which on prior occasions has held firm, thus raising the risk of a pullback.
USDJPY PRICE CHART: Daily Time Frame (Sep 18 – Jul 19)
USDCAD | Hovering Around 2019 Lows
As Canadian data continues to outperform, the Loonie remains buoyed with USDCAD hovering around 2019 lows. That said, given the outperformance of the Canadian economy relative market expectations eyes will be on next weeks Bank of Canada rate decision and whether the central bank looks to be a lone hawk or join the global dovish stance. As USDCAD tests support at 1.3050, the strength of the downtrend has begun to slow, nonetheless, a closing break below raises scope for a test of the psychological 1.3000 handle.
USDCAD PRICE CHART: Daily Time Frame (Aug 18 – Jul 19)

FX TRADING RESOURCES:
- See our quarterly USD forecast to learn what will drive prices through mid-year!
- Just getting started? See our beginners’ guide for FX traders
- Having trouble with your strategy? Here’s the #1 mistake that traders make
--- Written by Justin McQueen, Market Analyst
To contact Justin, email him at Justin.mcqueen@ig.com
Follow Justin on Twitter @JMcQueenFX


