


Bitcoin Price Outlook:
- BTCUSD briefly surged above $11,000 as buyers look to continue the string of gains the coin has enjoyed in 2019
- To that end, Bitcoin boasts a return of roughly 185% in the year-to-date
- Interestingly, retail traders have increased their long-positioning following the price surge
Bitcoin Price Probes $11,000 as Crypto Bulls Extend Their Run
After jumping nearly $750 on Friday, Bitcoin topped the psychological $10,000 mark for the first time since March 8, 2018. The move extends the coin’s incredible run in the year-to-date, with BTCUSD boasting a gain of roughly 185% in 2019. On Friday, I cautioned that weekend trading conditions would result in lower volume and therefore more drastic price swings, but hindsight reveals the move was etched amid healthy volume – adding credence to the move. That said, the coin may need to consolidate before bulls look to further its drive higher.
Bitcoin Price Chart: 1 – Hour Time Frame (May 16 – June 24) (Chart 1)
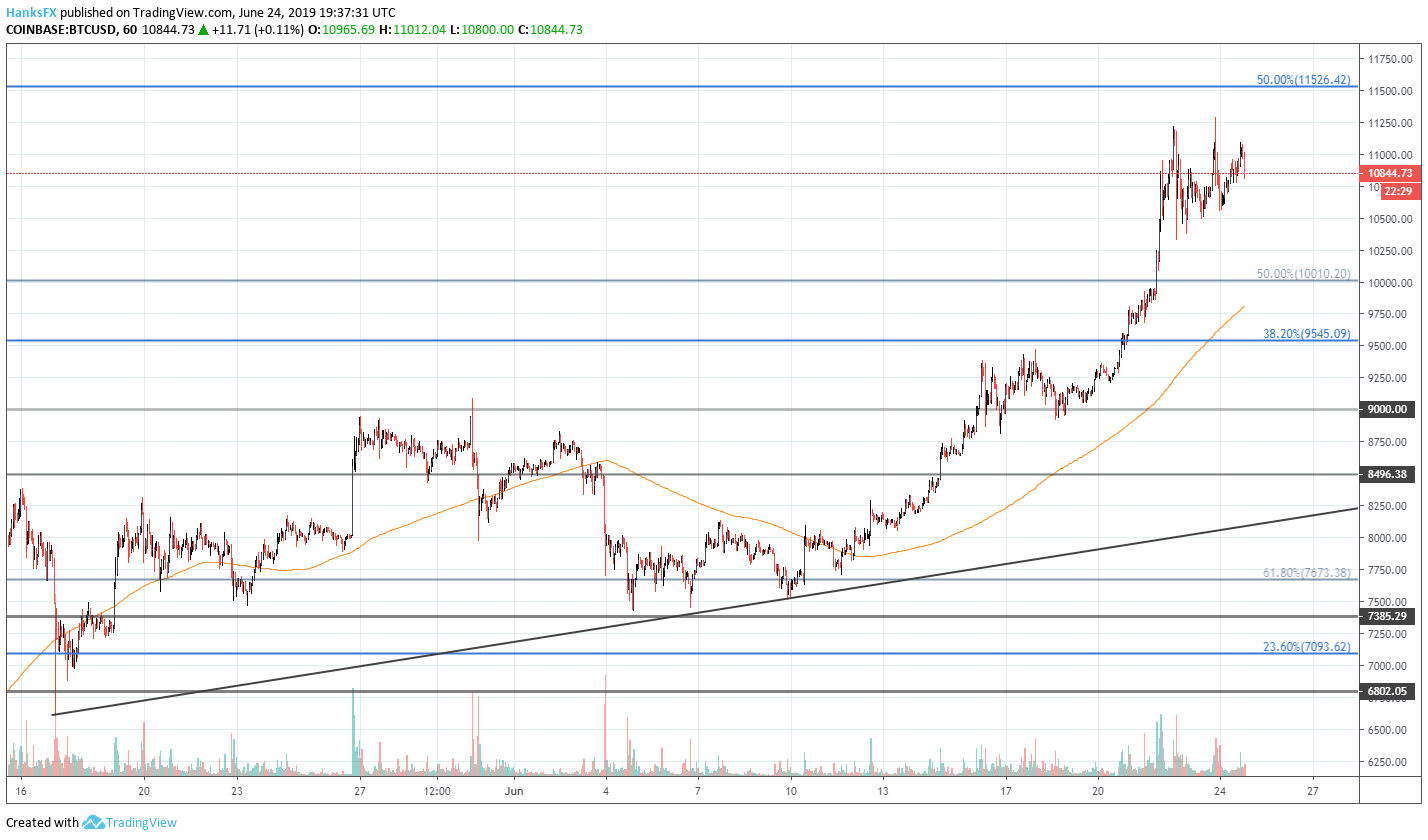
To that end, BTCUSD can now look to $10,000 as psychological support coupled with the nearby Fib levels at $9,545 and $10,010. Secondarily, an ascending trendline from mid-May could potentially join the fray if the two Fib levels prove insufficient. To the topside, Bitcoin will run into resistance around $11,550 – a level marked by the swing highs from February and March 2018.
Bitcoin Price Chart: Daily Time Frame (May 16 – June 24) (Chart 2)

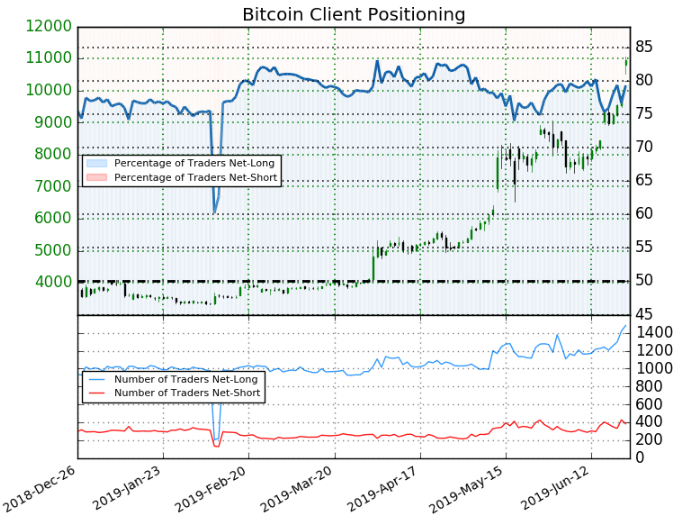
Despite the soaring price , retail traders are confident the Bitcoin rally will continue. Retail trader data shows 79.3% of traders are net-long with the ratio of traders long to short at 3.83 to 1. The number of traders net-long is 11.9% higher than yesterday and 17.8% higher from last week, while the number of traders net-short is 13.2% higher than yesterday and 1.3% lower from last week. Since, we typically take a contrarian view to crowd sentiment at DailyFX, retail trader positioning would suggest the price of Bitcoin may fall.
Similarly, the recent pace at which Bitcoin has climbed is reminiscent of its meteoric rise in late 2017 – and the similarities are not lost on investors and market pundits. With that in mind, consolidation would be prudent and could instill renewed investor confidence. Still, deteriorating emerging market currencies and the widespread media coverage of the cryptocurrency market with the arrival of Facebook’s Libra may continue to provide a tailwind for Bitcoin and other cryptocurrencies. Follow @PeterHanksFX on Twitter for more updates on BTCUSD and the cryptocurrency sphere.
--Written by Peter Hanks, Junior Analyst for DailyFX.com
Contact and follow Peter on Twitter @PeterHanksFX
Read more: AUDUSD & Nasdaq 100 Price Outlook: Huawei Offers Opportunity


