


DAX 30 Price Outlook:
- The DAX 30 soared to 12,330 – the 61.8% Fib level from January 2018 highs to December 2018 lows
- The fundamental and technical landscape offers a staging ground from which the DAX can attack May highs
- Retail traders are unconvinced of the Index’s strength and remain net-short. View our IG Client Sentiment data and learn how to incorporate it into your trading with one of our webinars
DAX 30 Price Surges to Resistance, Posts Biggest Gain in 5 Months
The German DAX 30 posted its best intraday performance since mid-January on the back of commentary from the European Central Bank. The potential to pursue further stimulus pressured EURUSD but bolstered the DAX which had been consolidating in the days prior.
Tangentially, President Trump announced that he and Chinese President Xi Jinping would meet at the G20 Summit in Japan to discuss trade. The meeting presents an opportunity for the two leaders to work toward a deal, but also breaks the deadlock in trade talks between the two nations. Together, loose monetary policy out of the ECB and the prospect of a trade war breakthrough pushed the DAX to 12,330. The 2.03% climb was the largest single-day gain for the Index since January 18 when it rose 2.63%.
DAX 30 Price Chart: Daily Time Frame (September 2018 – June 2019)
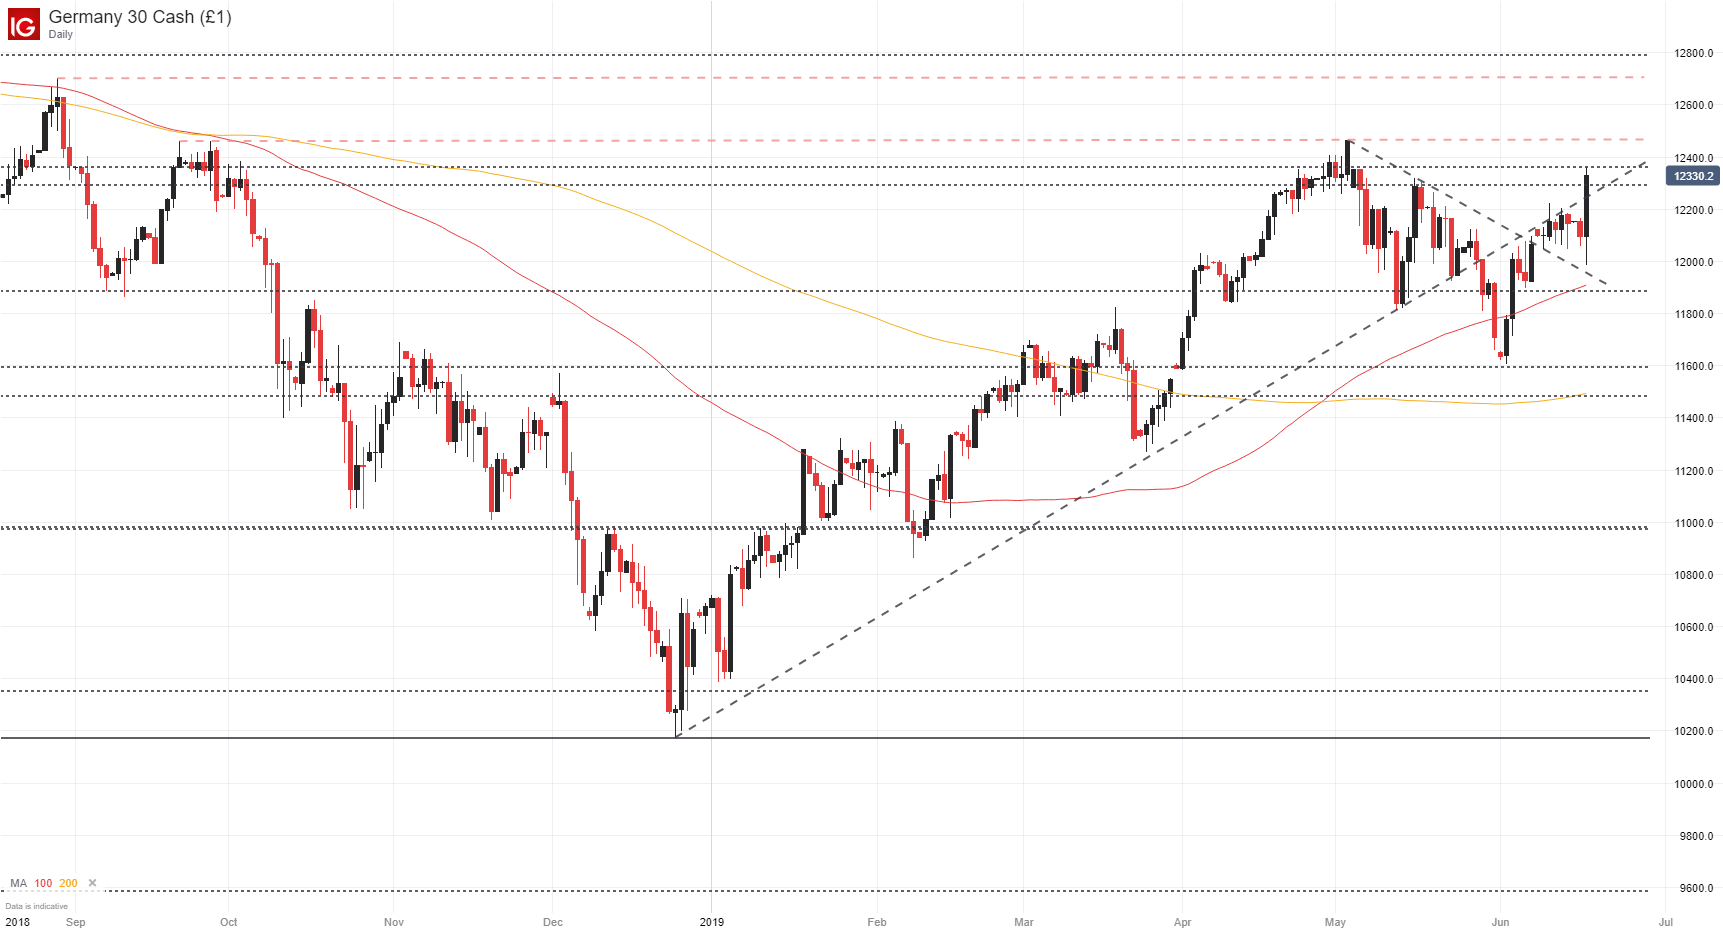
After passing through trendline resistance from early February, the DAX drove through subsequent Fibonacci resistance around 12,295 before it eventually stalled out beneath another point of Fib resistance around 12,362. The German equity index now enjoys a series of nearby technical levels which it can look to for support. Further, the tailwind offered by the ECB’s potential to pursue further easing could work in tandem to spur the DAX to test May highs around 12,467. The area will pose the next significant point of technical resistance. Should it be surpassed, secondary resistance will come into play – marked by the highs from August – around 12,700.
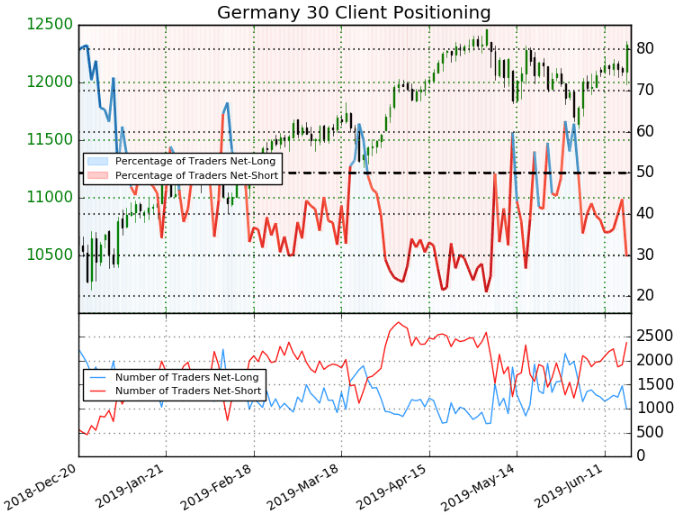
Retail traders, however, are not convinced. Retail trader data shows 29.6% of traders are net-long with the ratio of traders short to long at 2.38 to 1. In fact, traders have remained net-short since June 4 when the DAX traded near 11778.2; price has moved 4.7% higher since then. The number of traders net-long is 40.8% lower than yesterday and 22.1% lower from last week, while the number of traders net-short is 11.5% higher than yesterday and 4.4% lower from last week.
We typically take a contrarian view to crowd sentiment, and the fact traders are net-short suggests the DAX may continue to rise. Traders are further net-short than yesterday and last week, and the combination of current sentiment and recent changes gives us a stronger bullish contrarian bias for the DAX 30. With the technical, fundamental and retail trader sentiment signals aligned, the DAX looks primed to continue its recent strength.
--Written by Peter Hanks, Junior Analyst for DailyFX.com
Contact and follow Peter on Twitter @PeterHanksFX
Read more: AUDUSD & Nasdaq 100 Price Outlook: Huawei Offers Opportunity


