


Bitcoin (BTC) Price Outlook, Chart and Analysis:
- Bitcoin rally currently capped but higher prices cannot be discounted.
- Supportive technical should fuel the next move higher.
IG Client Sentiment Data show how retail are positioned in a variety of cryptocurrencies. See how daily and weekly positioning can affect our trading bias. Bitcoin (BTC) trade data shows 79.9% of traders are net-long, a strong contrarian bearish signal. However, recent daily and weekly changes in sentiment suggest a stronger bearish trading bias.
A Guide to Day Trading Bitcoin and Other Cryptocurrencies.
Bitcoin (BTC) Bulls Trapped in a Short-Term Holding Pattern
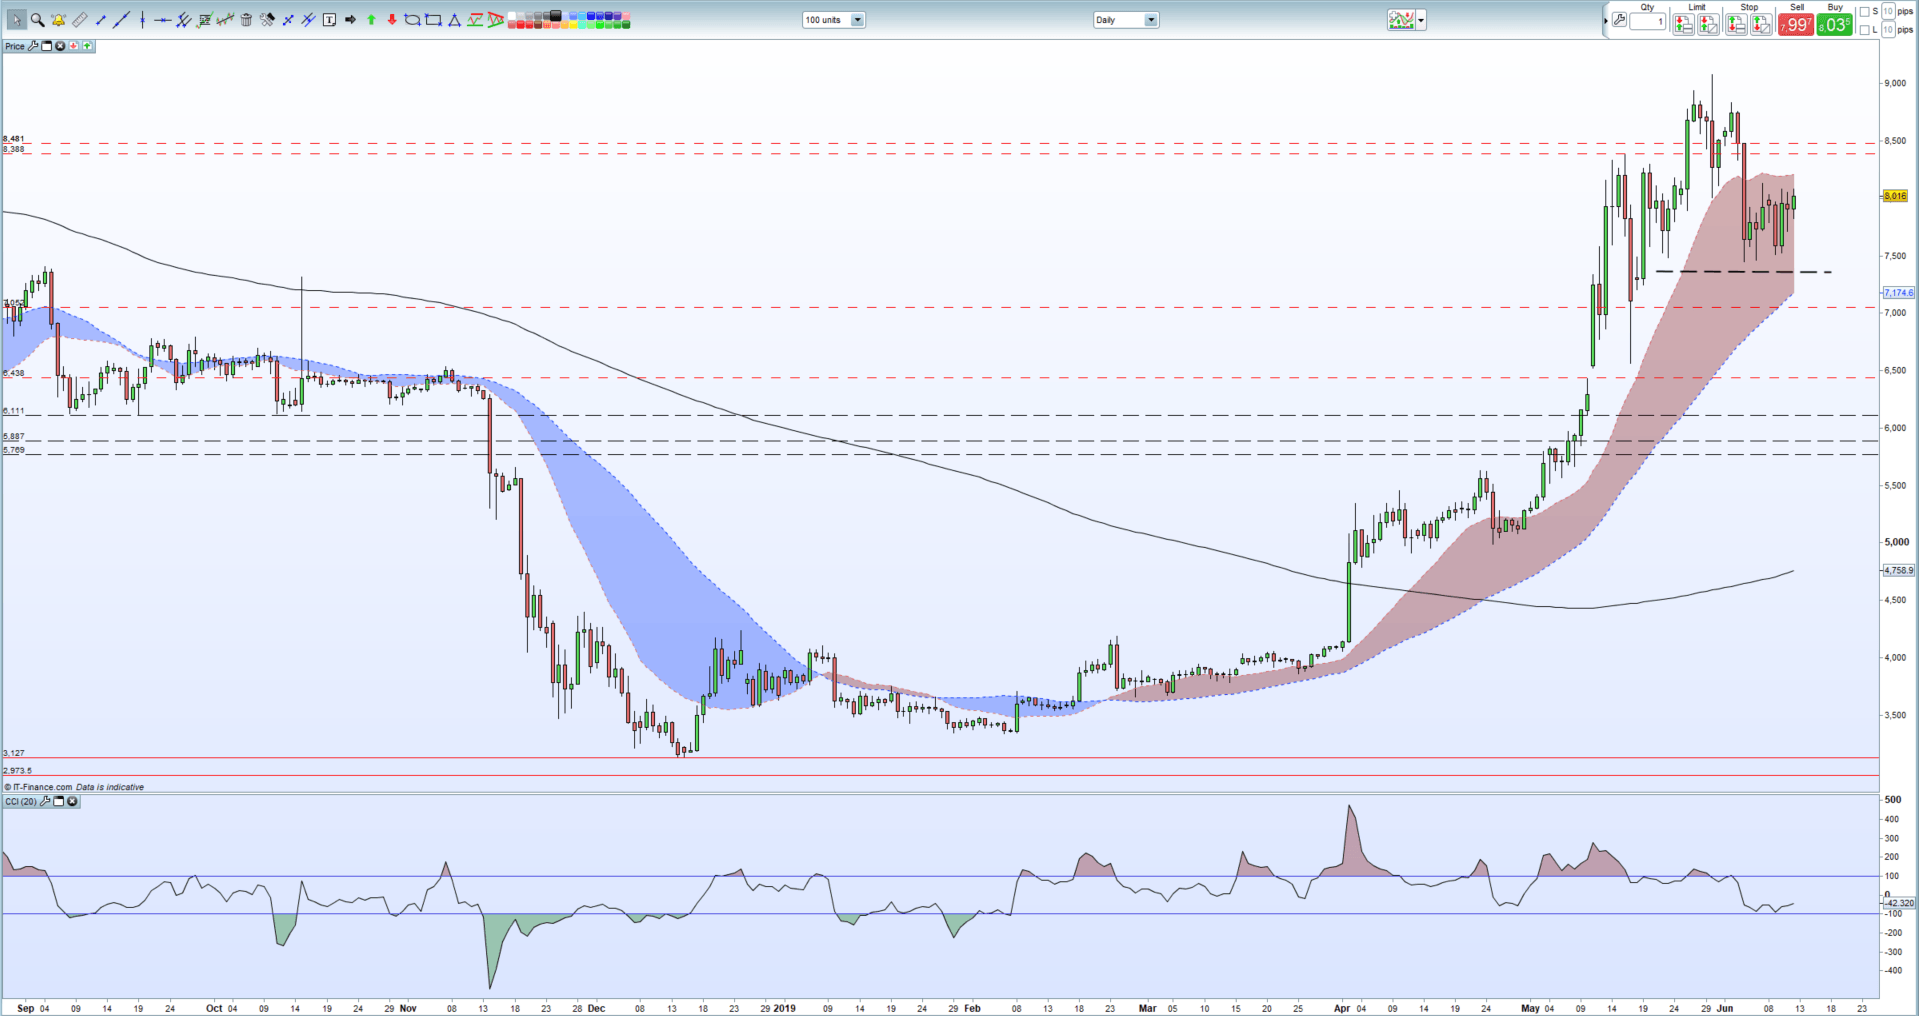
The largest cryptocurrency by market capitalization ($141.5 billion - 55.3%) trades just under $8,000 after having rallied more than 150% since the turn of the year. The longer-term bulls move was confirmed on April 2 when the cash price pierced the 200-day moving average and was strengthened when both the 20- and 50-day moving averages rose above the longer-term ma on April 12 and April 24. Higher volumes since the start of April aided the move higher.
Bitcoin now looks likely to make a fresh attempt at a new 13-month high ($9,080) and is building support around, and just above, $7,450 ahead of the next move. This support needs to hold on the daily chart. The CCI indicator shows Bitcoin bouncing off oversold territory suggesting that bullish momentum is holding.
To the upside, the first level of resistance is at $8,140, followed by old lower highs either side of $8,500 before the 13-month high at $9,080 comes into view. A break and sustained close above here suggests a new attempt at $10,000 before $11,600 to $11,970 come into play in the longer-term.
Bitcoin (BTC) Daily Price Chart (September 2018 – June 12, 2019)
Traders may be interested in two of our trading guides – Traits of Successful Traders and Top Trading Lessons – while technical analysts are likely to be interested in our latest Elliott Wave Guide.
What is your view on Bitcoin (BTC) – bullish or bearish?? You can let us know via the form at the end of this piece or you can contact the author at nicholas.cawley@ig.com or via Twitter @nickcawley1.


