


Crude Oil Price Chart and Analysis:
- OPEC still trying to get Russia to commit to ongoing production cuts.
- Technical set-up remains a negative bias.
The Brand New DailyFX Q2 2019 Trading Forecast and Guides are Available to Download Now!!
How to Trade Oil: Crude Oil Trading Strategies & Tips.
Crude Oil Needs a Fresh Driver
Crude oil opens within Monday’s $2 range and is likely to remain constrained in the short-term as OPEC continues to discuss extending the current production cuts. While most members are said to be onboard, Russia is still considering supporting cuts that have been in place since the start of the year and while they recognise the risks of over-production, energy minister Novak said that Russia would look at how events develop through June before committing to a further extension.
While the cessation of trade hostilities between Mexico and the US gave oil a small bid, the ongoing clash between the US and China will begin to ramp up in the next couple of weeks when additional tariffs will be introduced by the US. Global growth currently remains weak and further hostilities between two of the world’s largest economies will press down on oil.
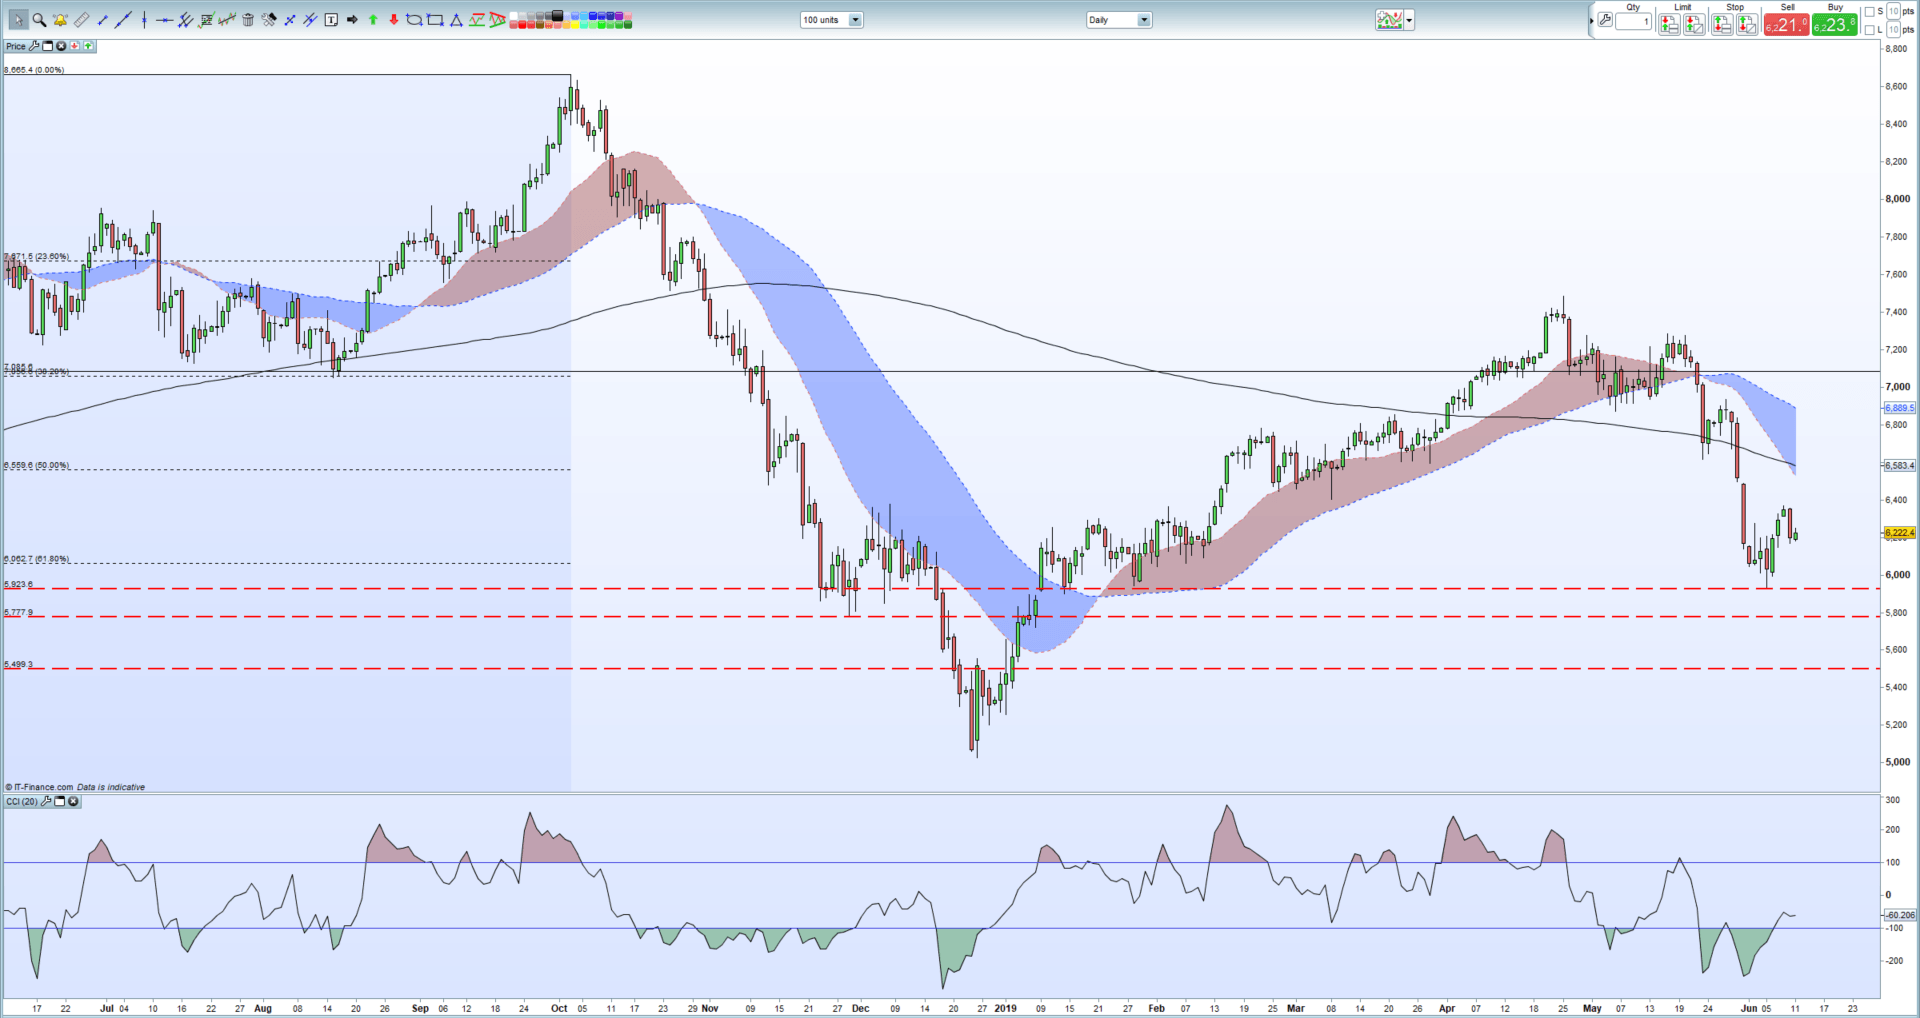
The latest daily chart shows oil little changed but with a negative bias. Crude remains below the important 200-day moving average, while the 20-day ma has just fallen through the longer-term ma, highlighting current bearish momentum. There is little in the way of support to stop crude re-testing the 50% Fibonacci retracement level at $60.63/bbl. before the June 5, multi-month, low comes into focus. Crude has moved out of oversold territory, after hitting extremes in late May and earlier this month. To the upside, $63.50/bbl. before a tight zone between $64.90/bbl. and $65.80/bbl.
WTI vs Brent: Top 5 Differences Between WTI and Brent Crude Oil
Crude Oil Daily Price Chart (June 2018 – June 11, 2019)
Traders may be interested in two of our trading guides – Traits of Successful Traders and Top Trading Lessons – while technical analysts are likely to be interested in our latest Elliott Wave Guide.
What is your view on crude oil – bullish or bearish?? You can let us know via the form at the end of this piece or you can contact the author at nicholas.cawley@ig.com or via Twitter @nickcawley1.


