


Gold Price/Silver Price, Analysis and Charts.
DailyFX Q2 USD and Gold Forecasts and Top 2019 Trading Opportunities.
Gold – A Bout of Profit-Taking?
Gold opens the session around 0.50% lower at $1,328/oz, around $20 lower than Friday’s post-NFP spike high. Friday’s $1,348/oz. print saw gold trade at its highest level since April 2018 but news over the weekend that us tariffs against Mexico have been put on the back burner has taking some of the risk-off premium out of the precious metal.
Price action in June has seen the series of lower highs broken decisively and suggests higher prices ahead. Gold trades above all three moving averages – with the 200-dma proving its support on May 21 and May 30 – while the CCI indicator shows gold coming out of extreme overbought conditions. The chart shows a cluster of support between $1,310/oz and $1,324/oz. made up of old lower highs and a gap on the June 3 bullish candle. Any fade lower into these levels may spark further upside momentum.
How to Trade Gold: Top Gold Trading Strategies and Tips
Gold (XAU) Daily Price Chart (October 2018 – June 10, 2019)
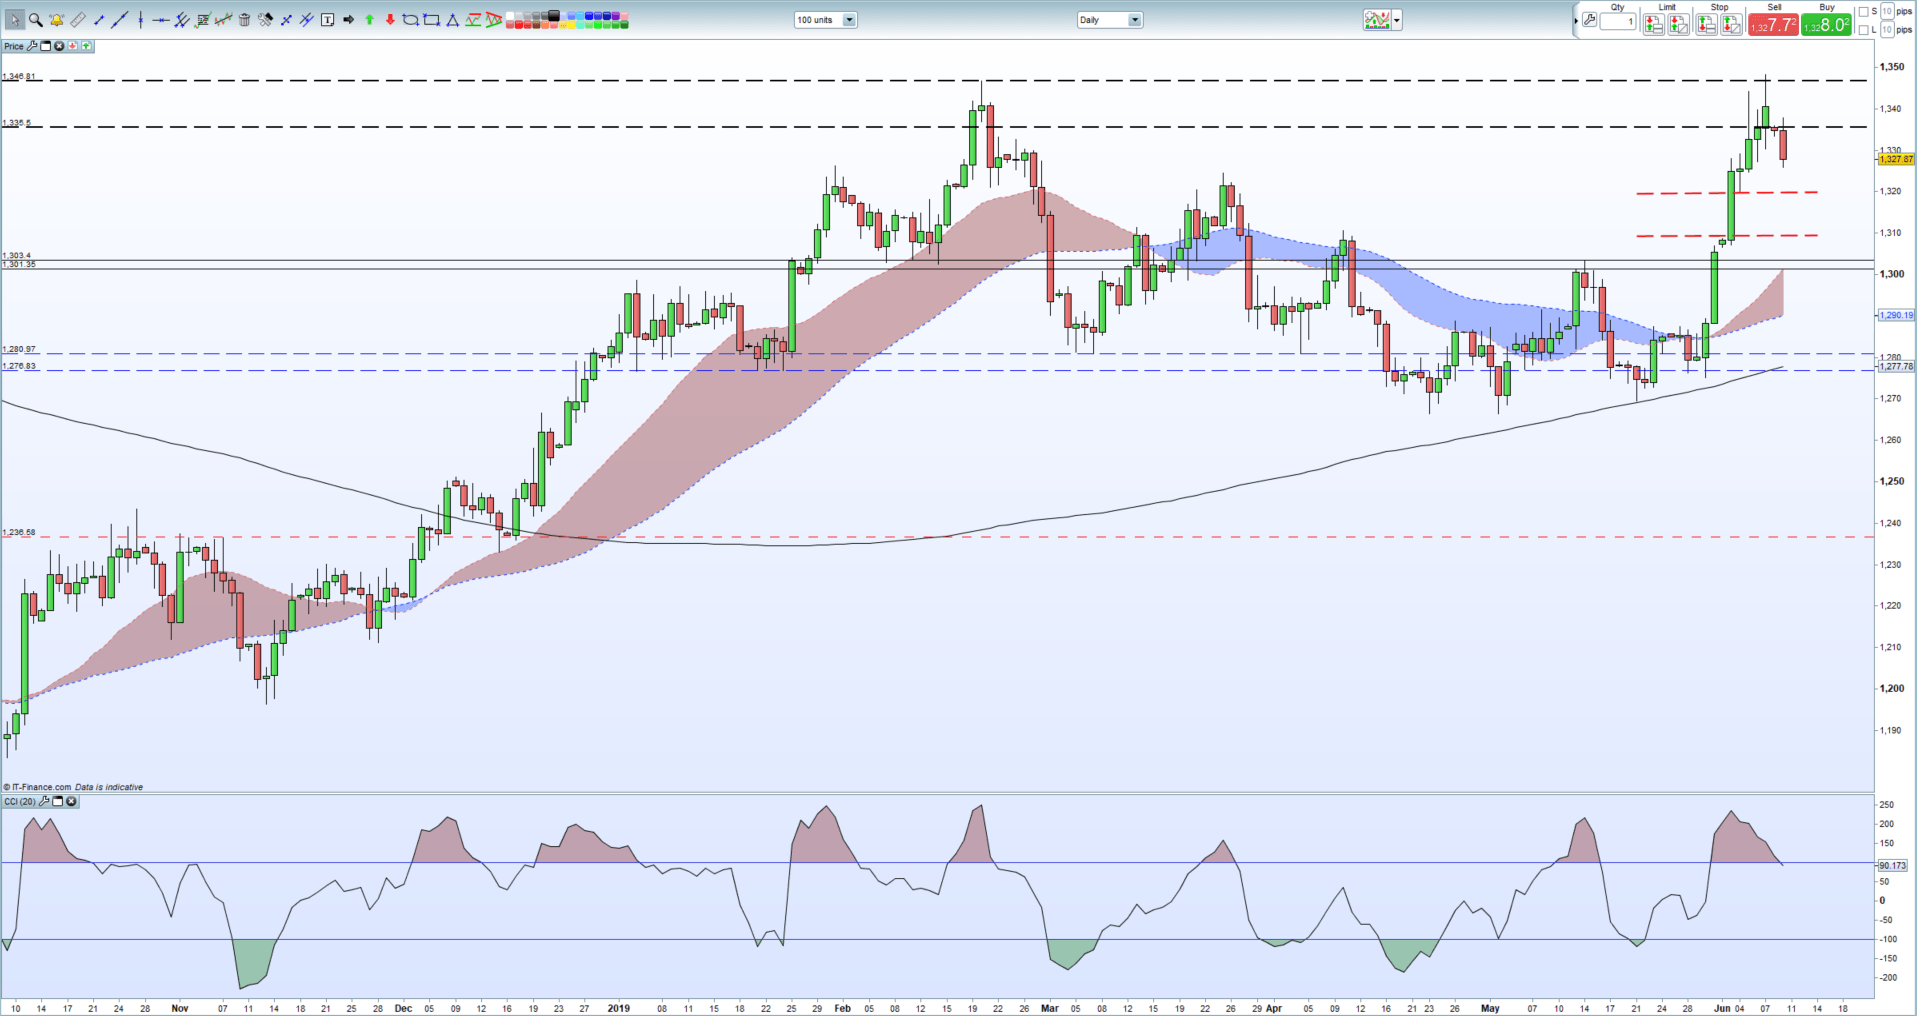
IG Client Sentiment shows that retail traders are 53.6% net-long gold, a bearish contrarian indicator. Recent daily and weekly sentiment shifts however suggest that spot gold may soon reverse higher.
Silver Runs into Resistance
After rallying more than 6% since the recent low print on May 28, silver has turned sharply lower at the start of the week. The 200-day moving average ($15.02) – broken last week but not closed above – remains firm resistance for silver, while slightly lower the 23.6% Fibonacci retracement level at $14.92 should also be watched. The longer-term negative chart outlook has been broken, but silver needs to find support before further upside action can take place. A cluster of prior lows/highs either side of $14.65 may provide short-term support.
Silver Daily Price Chart (July 2018 – June 10, 2019)

Trading the Gold-Silver Ratio: Strategies and Tips
--- Written by Nick Cawley, Market Analyst
To contact Nick, email him at nicholas.cawley@ig.com
Follow Nick on Twitter @nickcawley1


