EURUSD Price, Chart and Analysis:
- EURUSD battles with technical resistance as short positions are reduced.
- ECB President Mario Draghi speaks on Wednesday.
Q2 2019 EUR Forecast and USD Top Trading Opportunities
Keep up to date with all key economic data and event releases via the DailyFX Economic Calendar
EURUSD continues to trade either side of 1.1300 Monday and may resume its move higher as US dollar traders continue to price-in Friday’s lowly US non-farm payroll numbers. The single currency is pushing ahead despite seeing the 10-year Italy-German yield spread widening again - currently around 268 basis points – as investors trim their EUR short positions.
EUR and JPY Shorts Cut as USD Bulls Scale Back – COT Report
There is little heavyweight data in the week ahead although ECB President Mario Draghi will be speaking on Wednesday and, as always, his words need to be carefully listened to, especially after last week’s monetary policy meeting. The ECB said that rates would stay lower for longer and subsequent commentary that rate cuts had been discussed underlined the weakness in the Euro-Zone with growth weak and inflation anemic.
Recent data from CLS, a major FX-settlement service provider, showed that foreign exchange turnover fell by 9.6% year-on-year in May as a lack of volatility pushed traders to the sidelines.
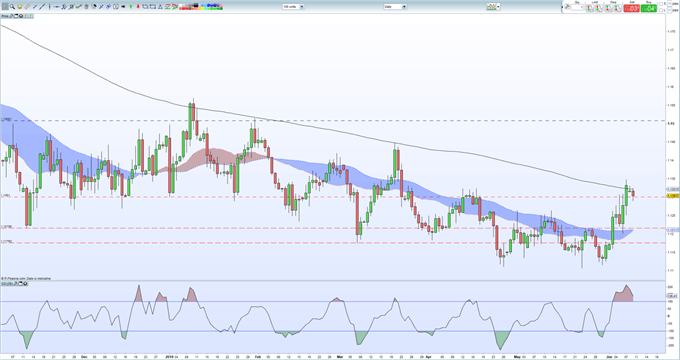
EURUSD is currently pressing the 200-day ma, a technical indicator that has held sway for over a year. Although broken, the pair have not yet closed above the long-term indicator, but current momentum suggests this battle will continue in the short-term. A close above would open the way to 1.1348 before 1.1450, the March 20 lower high comes into play.
EURUSD Daily Price Chart (November 2018 – June 10, 2019)

Retail traders are 39.7% net-long EURUSD according to the latest IG Client Sentiment Data, a bullish contrarian indicator. However recent daily and weekly positional changes give us a stronger contrarian bullish bias.
We run several Trader Sentiment Webinars every week explaining how to use IG client sentiment data and positioning when looking at a trade set-up. Access the DailyFX Webinar Calendar to get all the times and links for a wide range of webinars.
Traders may be interested in two of our trading guides – Traits of Successful Traders and Top Trading Lessons – while technical analysts are likely to be interested in our latest Elliott Wave Guide.
What is your view on EURUSD – bullish or bearish? You can let us know via the form at the end of this piece or you can contact the author at nicholas.cawley@ig.com or via Twitter @nickcawley1.


